Activity 5: Discerning Patterns of Earthquakes
IRIS is an acronym for Incorporated Research Institutes for Seismology. There web-site (www.iris.edu) houses the IRIS Earthquake Browser (www.iris.edu/ieb/index.html) which you will utilize for the next part of this lab. You will do a couple of small activities meant to familiarize you with the controls and options of the web-site, and then you will be in charge of your own investigation.
Part 1
- Once you have the map up with events recorded on it, place your cursor over the different circles and note that you will call up the pertinent information for the event. If you click on the event, you will pull up a table showing the stats for the 10 closest events to the one you have identified. Running your cursor over this list will cause the corresponding dot on the map to “bounce”, indicating where the event took place.
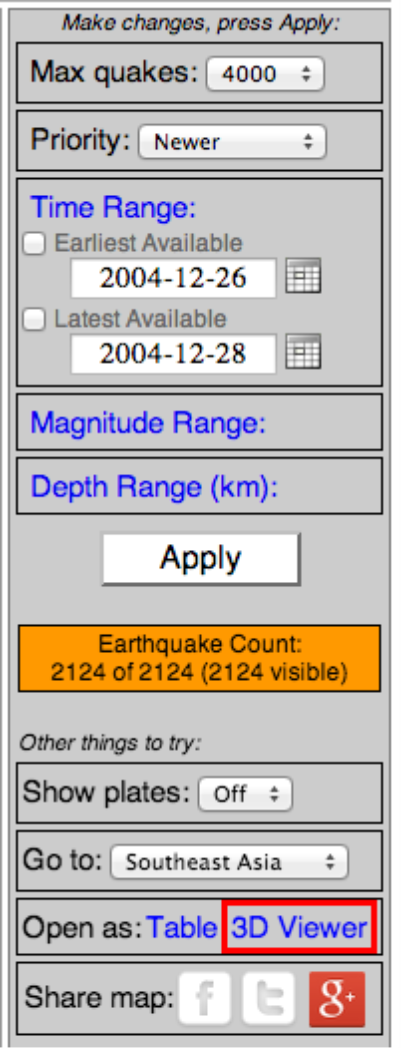
- Max quakes: You can click your cursor on the max quakes button and change the number of events that show up on the map. If you attempt very high numbers you may stall the program. I’ve had good success staying at 4,000. You always need to click on “Apply” to get a new map updated to your specifications
- Priority: Click this button to see either the newest earthquakes or the larger ones. Click back and forth a couple of times and see if you notice a difference in the output.
- Time Range: Here you can set the time in history you wish to observe in terms of earthquake occurrence. You can either get the broadest range by checking “Earliest Available” and “Latest Available”, or you can narrow a search to within sets of days. Do a couple of searches here. Look at a time range of 1 year and count the number of events taking place (Earthquake Count) in that year. Do this a couple of more times using different years. Record your data. How consistent are earthquake events from year to year? Based a yearly number, do the math to determine the number of earthquakes that happen daily. Compare this result to several 24-hour time periods throughout the year. Record all of your data and give a brief (one to two sentence) description of your findings.
- Magnitude Range: You can change the magnitude of events shown of the map by delineating it in the magnitude range option and then clicking on “Apply”. Collect data and create a graph that shows the earthquake count of magnitude 1, 2, 3, etc. events that happen per your choice of time range. Be aware that many times, there will be more events than the amount shown on the map. So, if the “Earthquake Count” states “2000 of 68574”, then you are interested in the 68574 as the number of events within that time and magnitude range. Create a data table for your results and graph your data. Give a brief (one or two sentences) description of this data. What patterns of occurrence did you find from low magnitude events to the very high magnitude events?
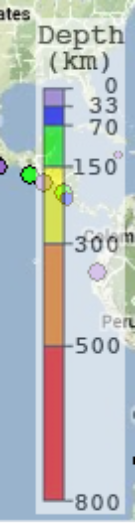
- Depth Range: Change the range of depth for displayed events to match the color scale of depth on the map. Keep track of how many events take place at each depth range, and what pattern in location might take place by depth as well. Make a Depth vs Earthquake Count graph give a brief (one of two sentences) description of the patterns of earthquake locations when categorizing them by depth.
- Show plates: We are just going to leave them “off” for now.
- Go to: This button will give you a menu that breaks the globe into smaller parts for more detailed study. Utilize this feature a few times to take a closer look at different seismically active parts of the earth. Notice (but you do not have to write anything down) whether different seismic patterns exist in different regional maps, or if you can discern different patterns within any regional maps.
- Open as: If you click on “Table”, you will get a list of all the events on the map and you can organize them by date, magnitude, depth, region, etc. You can find specific data and waveform information if you click on the hyper-link associated with the event in the “EXPLORE EVENT ID”. Lastly, if you click on “3D VIEWER” you will get the events in, you guessed it, three dimensions. You can pick different regions from the “Go to” menu and play around with the orientations in space to give a better understanding of the geometry of the earthquakes in space.
Part 2
Now that you have had a chance to familiarize yourself with this visual model, let’s see if you can put it to some use. Your job from here is to develop a question that takes into account the different variables with which you now have experience, and then investigate that question, collect data, and make evidence based claims based on collected data generated by this model.
- Record your question for investigation.
- What caused you to ask this particular question?
- Give a prediction of what you think the answer to your question will be. Why do you think that?
- List the variables that are involved in your investigation. Which will you be controlling?
- Describe the structure of your investigation. In other words, what steps are involved in your investigation?
- Conduct your investigation.
- Collect and tabulate your data.
- Make a claim or claims (hopefully in answer to your question) and support those claims with evidence from your data.
- Conclude with a discussion of the importance of your claim, and how it relates to what we have talked about in terms of earthquake hazards.
Acknowledgements: I owe a debt of gratitude to Mike Hubenthal, education and outreach specialist for IRIS. The “Earthquake Machine” write-up and the “Finding Epicenters” write up were based heavily on his original development of these activities. He also provided good, critical feedback on initial drafts of this document.
References
Hubenthal, M., Braile, L., Taber, J. (2008). Redefining earthquakes & the earthquake machine. The Science Teacher, 75(1), 32-36.