I Feel the Earth Move Under my Feet: The history of earthquake intensity and magnitude

By Esther Muturi and Glenn Dolphin
(USGS, 2023) Near dawn on February 6, 2023, at 4:17 a.m. local time, residents of Pazarcık City in southern Turkey experienced powerful shaking. Witnesses described their experiences of being shaken from their sleep, some running to their cars for safety from the damaged buildings. “I have never felt anything like it in the 40 years I’ve lived,” said Erdem, a witness living in Gaziantep. “We were shaken at least three times very strongly, like a baby in a crib (Brewer & Kerley, 2023).”
The degree of utter devastation by the earthquake and its aftershocks were displayed on social media via videos posted by people in Turkey and Syria. The world watched helplessly as horrifying images of collapsing buildings and shattered lives in Turkey and Syria were beamed on screens and printed in newspapers. The death toll from this disaster reached 45,000 in Turkey and about 5,000 in neighbouring Syria. According to news reports, this phenomenon hurled more than 160,000 buildings, containing 520,000 apartments, off their foundations and damaged other infrastructure as well. It was the worst disaster in Turkey’s modern history (Reuters, 2023). The extent of surface ruptures associated with the shaking has been mapped using satellite imagery and ground observations. Images captured before and after the earthquakes show sharp discontinuities in displacement, revealing two separate zones of surface rupture (Sommerville & Evans, 2023).
From the reports given, it is obvious that different people use different ways to describe the size or power of such an event. The first witness above described the phenomenon based on a feeling of being shaken very strongly, “like a baby in a crib.” For many watching the videos, the size of this phenomenon was based on the reported death toll, destruction of houses and infrastructure, the surface tear, and the effects of the earthquake. Yet, for others, it is a number designated by scientists, magnitude 7.8 (USGS, 2023), that describes the earthquake. This case study explores how we have described earthquakes from past to present, to help us better understand this phenomenon.
Introduction
An earthquake is an English word that means “a shaking or movement of the ground; esp. a violent convulsion of the earth’s surface, frequently causing great destruction, and resulting from movements within the earth’s crust or from volcanic action” (Oxford English Dictionary, 2010) The French call it, tremblement de terre, while the German word for earthquakes is erdbeben, the Japanese word is (地震) jishin, and the Chinese is (地震) dìzhèn; all means “earth-shaking” (Milne, 1886/2024). We have come to understand the released energy, which causes earthquakes, through our history of observations of the effects of that energy.
An increased risk of earthquake disasters exists in western and eastern Canada. Because of this, the Canadian government (Earthquakes Canada, 2025) is doing what many other earthquake-prone countries (Mexico, Japan, the United States, and others) have done to mitigate loss of life and property. Specifically, it is implementing an earthquake early warning (EEW) system capable of alerting and warning the public of impending shaking, from a few seconds to almost a minute before the shaking happens. The alerts are sent to people and infrastructure locations that may experience damaging vibrations, allowing people time to take appropriate protective actions (drop, cover, and hold on). An EEW system can detect an earthquake seconds after it begins, calculate its location and magnitude, and estimate the resulting shaking intensity for surrounding areas. Alerts go out when certain intensity and magnitude thresholds have been met (Given et al., 2018).
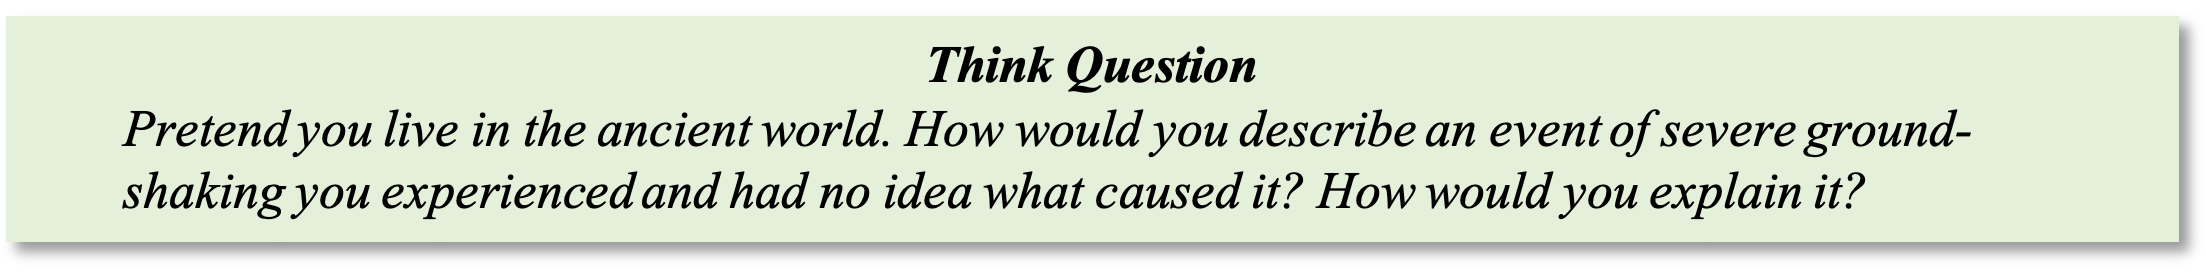
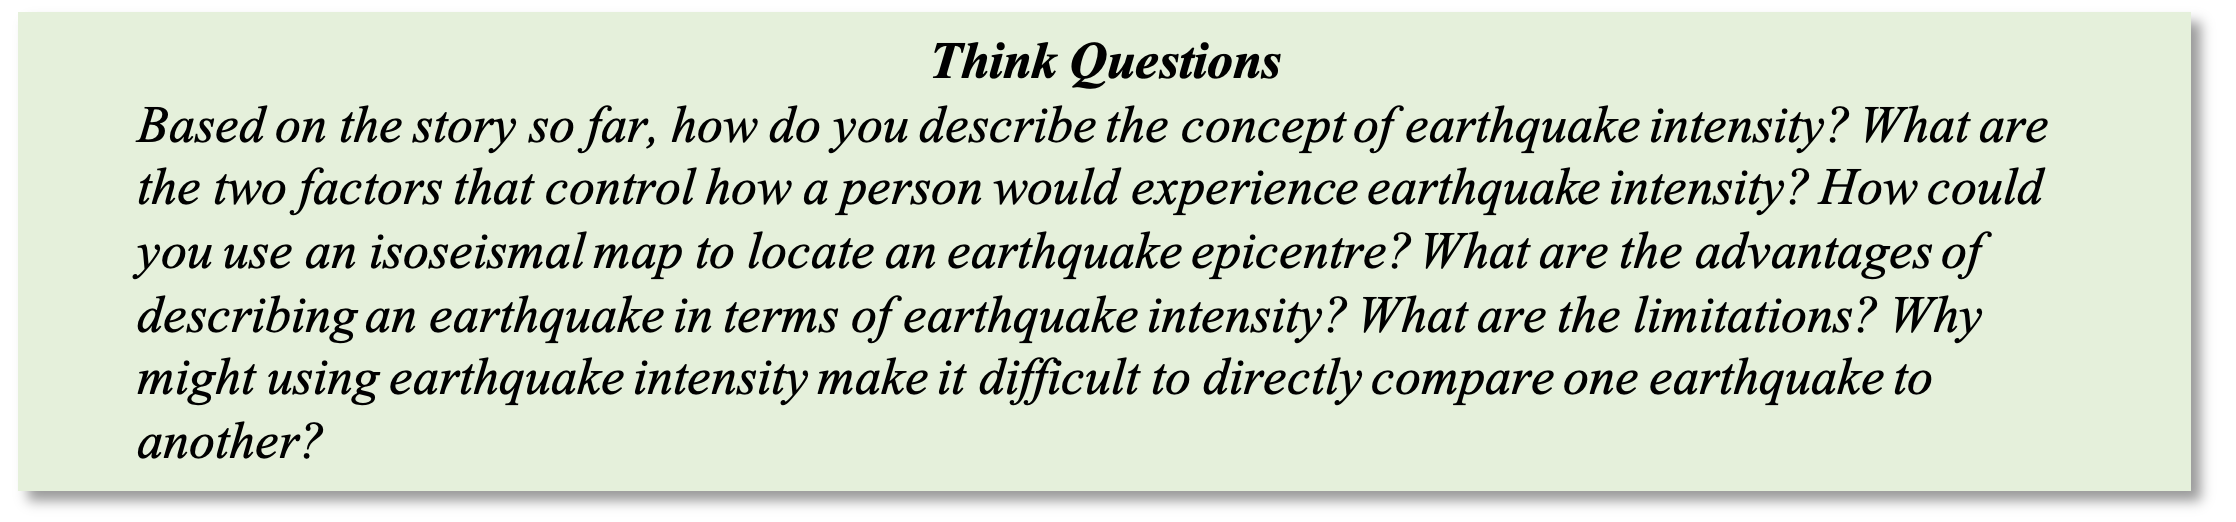
To maximize the efficacy of the EEW system, it is essential that the public trusts it, which improves their situational awareness immediately following the early warning. Since the alerts are sent based on meeting thresholds of both intensity and magnitude, educators and science communicators must clearly present the science of these two concepts, which reflect the energy released during an earthquake. As history is an effective vehicle for enhancing people’s understanding, the following historical overview explores the developmental trajectory of the concepts of earthquake intensity and magnitude. We review the historical literature on these concepts’ development, from some of the earliest recorded accounts to modern times. We go on to consider the various tools used, including the increasing role of various technologies and the emergence of standard measures. This paper is at once a narrative recounting the development of the concepts of intensity and magnitude but is also intended to be a tool for instructors to use for teaching these concepts. To aid in the use of it as a teaching tool, we include some “Think Questions,” episodically along the way. These are intended to spark engagement and discussion, whether in the classroom or outside of it. As such, these questions are addressed directly to readers.
The Earliest Encounters with Earthquakes
In the ancient past, many cultures experienced disastrous “ground-shaking” events of unknown cause, but their effects were clear. The deadliest earthquake on record happened in China and claimed almost one million lives. In the winter of January 23, 1556, an earthquake struck Shaanxi province, China, causing mountains and rivers to change positions; new hills and valleys were formed, huts, temples and city walls collapsed, and with them 830,000 human deaths occurred (Carter, 2023). Thus, peoples of the past looked for ways to explain these natural phenomena. One strategy was through developing stories, what we now typically call myths, as shown in Table 1. These tales were relayed by word of mouth, a common means for knowledge dissemination in centuries past.
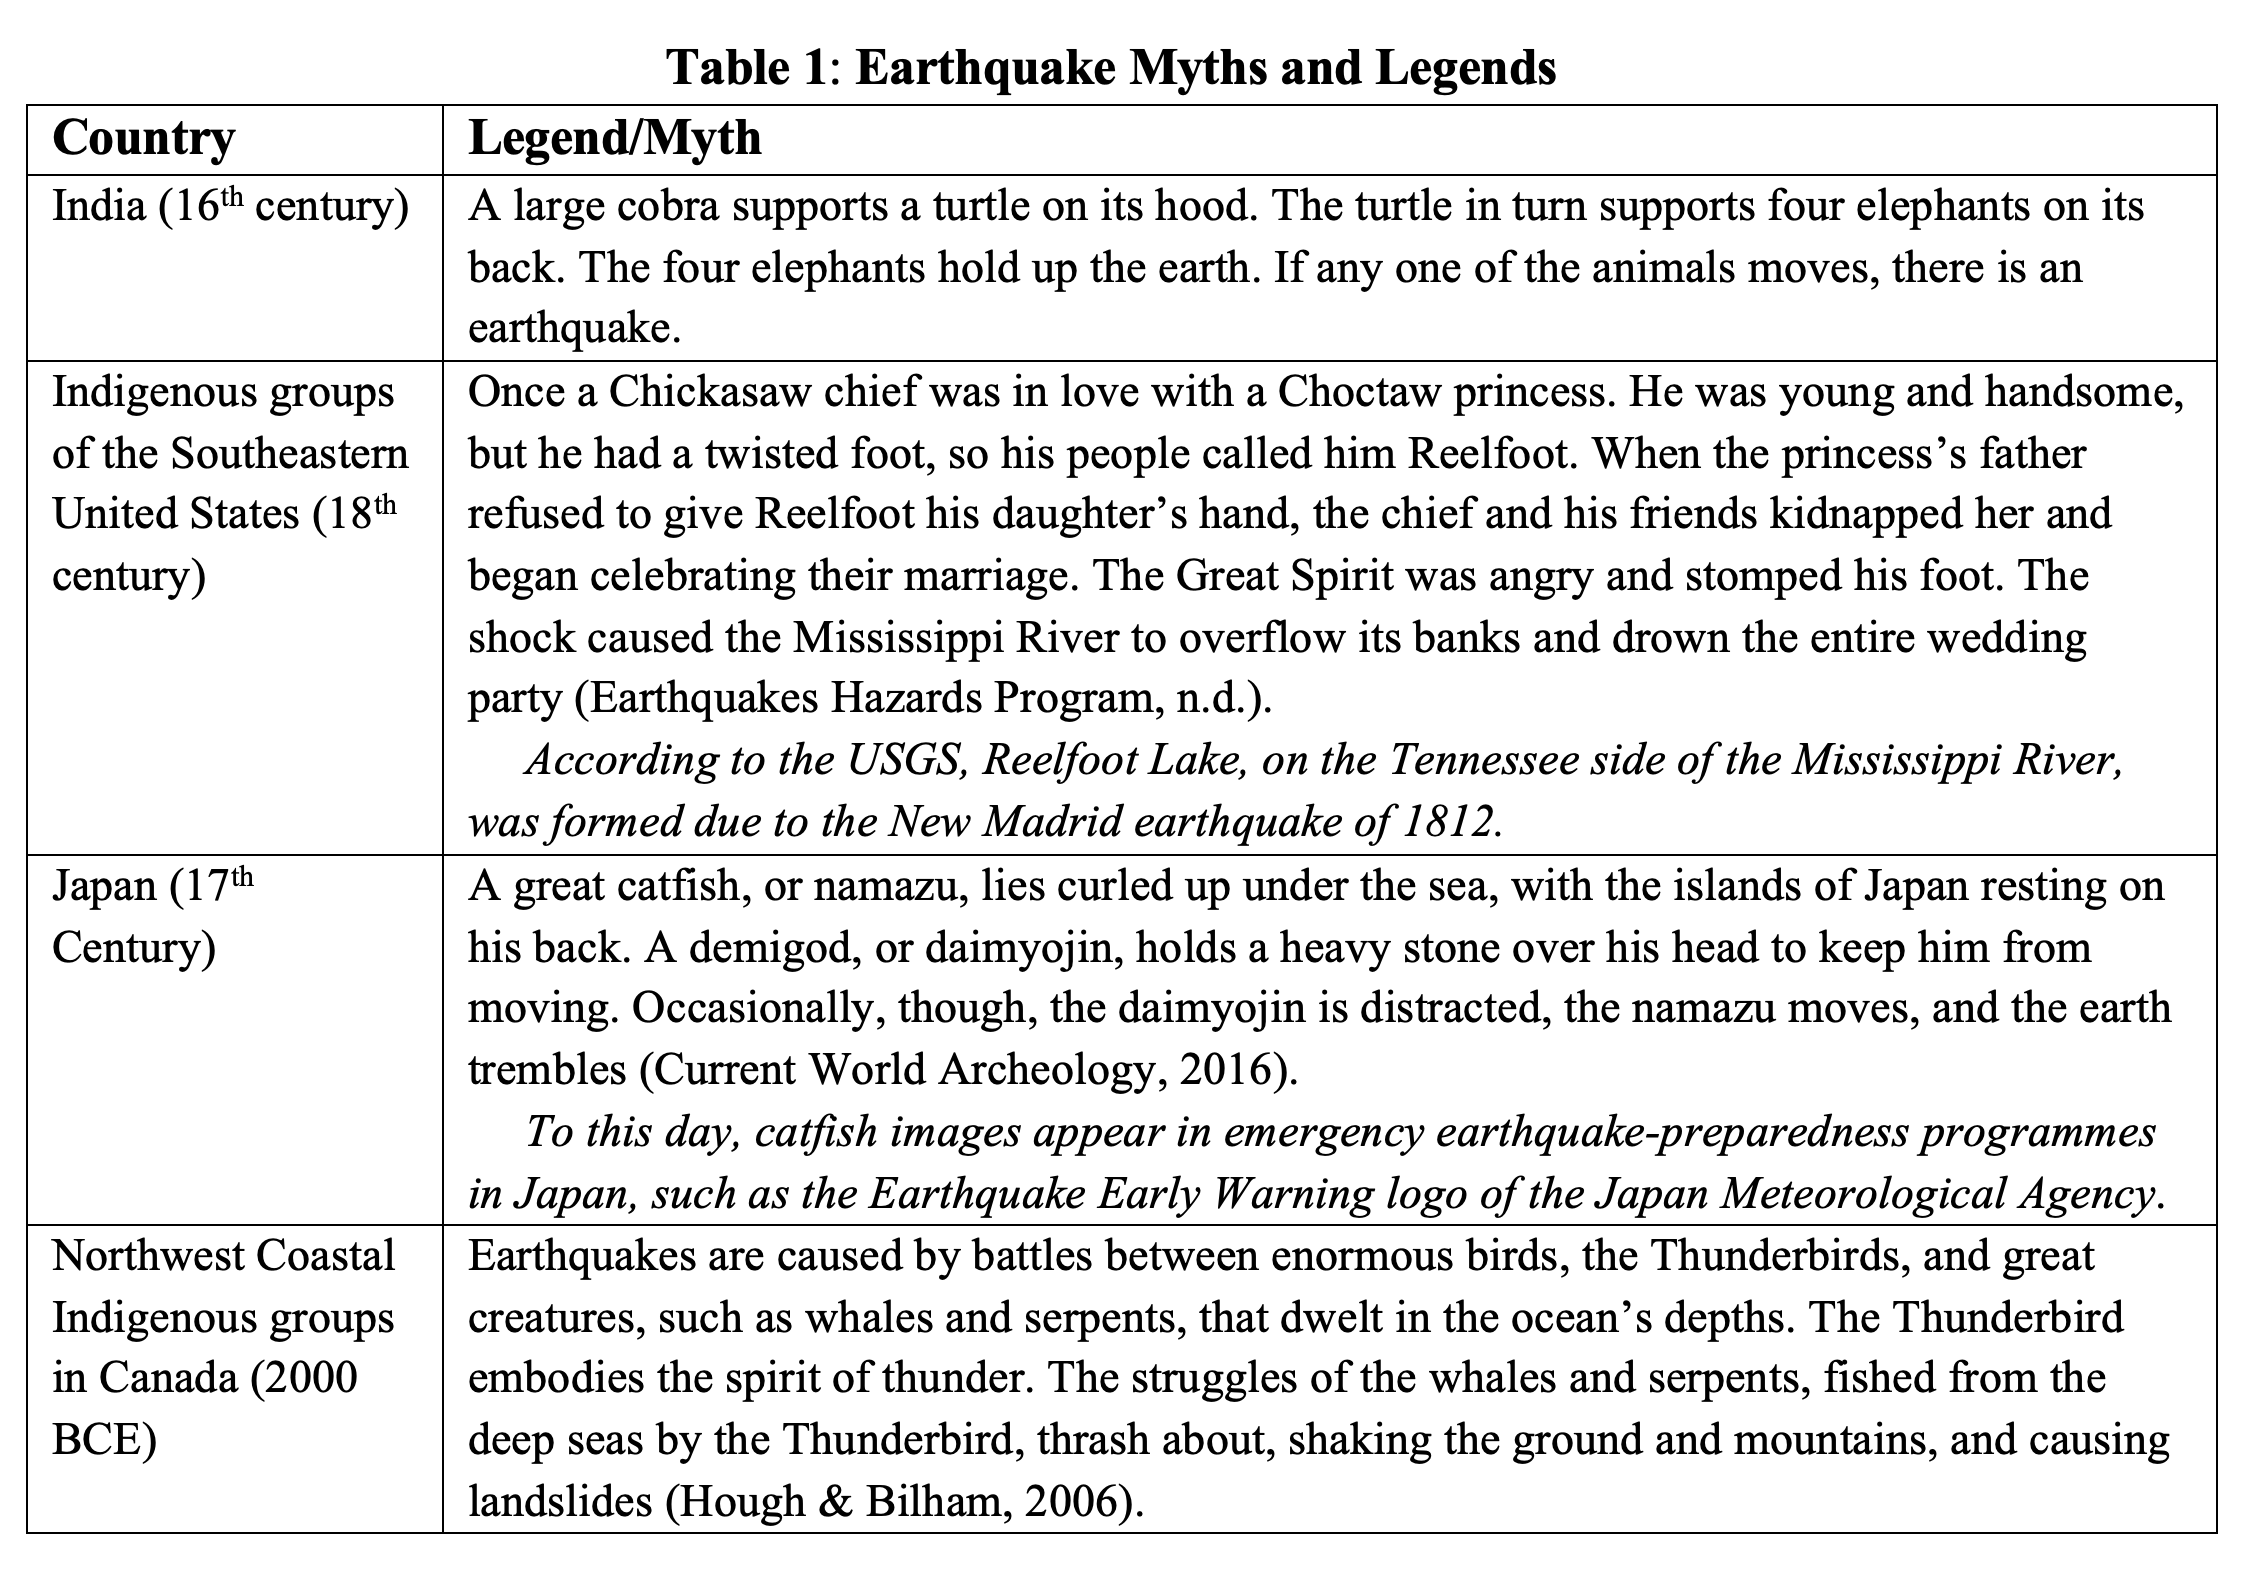
From the few examples above—to which many more could be added—earthquakes, with their associated shaking, are due to the actions of mythical characters with supernatural powers.
From Shaking to Impulses and Their Direction
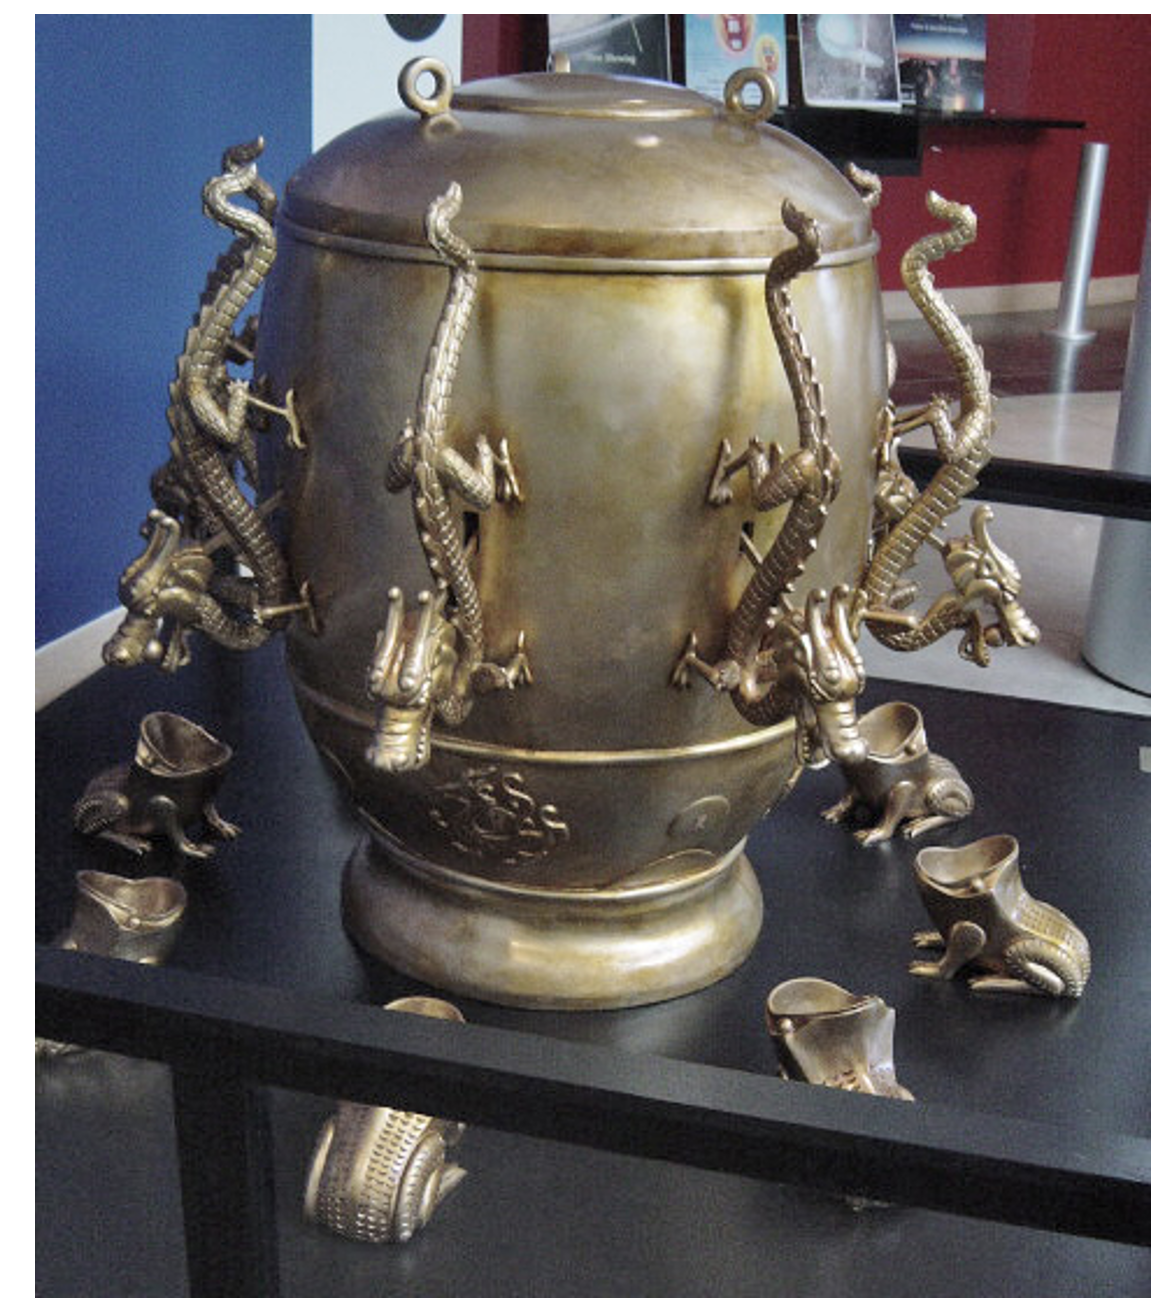
In 132 CE, China was an enormous geographic area with one ruler that experienced numerous large earthquakes. The emperor would require knowledge of when and where an earthquake happened so as to send aid from a central location in a timely manner for victims of such events. To accommodate this need, the astronomer Chang Heng developed an instrument to indicate the direction of shaking’s source. Shown in Figure 1, this instrument is now known as a seismoscope. This ancient one is a rounded copper vessel, with a diameter of eight feet. On the outside of the vessel are eight dragon heads (the mythological gods), each holding a ball in its mouth. Aligned below each head is a frog that appears to watch the dragon’s face, ready to receive the ball if it should drop. When an earthquake occurs and the vessel is shaken, this triggers the dragon most closely aligned with the direction of the travelling energy to drop its ball; the frog that receives it vibrates vigorously. Anyone watching this instrument could easily estimate the direction of the earthquake’s arrival (Milne, 1886/2024)
In one instance, a dragon dropped its ball without any earthquake being observed, undermining belief in the instrument’s usefulness; however, a few days later, a notice arrived with information that an earthquake had indeed occurred at a far-off place called Rōsei. With this news, doubters began to believe in the instrument again (Milne, 1886/2024). This story reveals that although the seismoscope was markedly distant from the event, at a site where the earthquake’s shaking was not perceptible, the device was nevertheless sensitive enough to register the direction of even very small tremors. This directional attribute of earthquakes, as illustrated by the seismoscope, began to inspire thinkers and observers of these times to conceptualize earthquakes in more naturalistic ways.
Advancements in Thinking About Earthquakes During the Enlightenment
Sapere aude! [Have courage to use your own reason!]
Kant, 1784
Just as astronomy existed long before the telescope, so did the study of earthquakes exist long before seismology and seismographs. In ancient astronomy, stargazers observed the sky with their naked eyes and measured the brightness of the stars as they appeared to them. Similarly, to measure the size of earthquakes, naturalists observed the systematic behaviour of the shaking and the aftermath effects as felt by witnesses. In this next section, we review three major earthquakes in Europe from 1755 to 1828, considering the information scientists collected about them to shed light on interpreting the dangers earthquakes pose and how to avoid them.
Lisbon Earthquake (1755)
Hough and Bilham (2006) provide an effective account of this devastating earthquake, which struck in Lisbon, Portugal on All Saint’s Day, November 1, 1755. They draw on the remarks of the witness Reverend Charles Davy, who described what he observed and how it felt. He was in his apartment preparing for Mass that bright Sunday morning, when he felt a gentle motion that grew to a trembling of the house some time between 9:00 and 10:00 a.m. He initially attributed it to the rattling of several coaches in the main street, but a frightful underground noise soon followed the initial rattling. Shortly thereafter, he heard a horrible crash, as if every structure in the city had just tumbled down at once. His apartment building shook so violently that the upper stories above him immediately fell. Though his apartment on the first floor did not share the same fate, everything was thrown out of its place. Going outside, he witnessed the tremendous destruction of his home and city, a disturbing sight for him and many others who gathered in the streets. But another great rumble was on the way. The following quote from Eva March Tappan (1914) vividly puts into words Davy’s feelings about what was happening—that things could not get any worse, until he heard someone shout that the ocean was coming in:
You may judge of the force of this shock, when I inform you, it was so violent that I could scarce keep on my knees; but it was attended with some circumstances still more dreadful than the former. On a sudden I heard a general outcry, “The sea is coming in, we shall be all lost.” Upon this, turning my eyes towards the river, which in that place is nearly four miles broad, I could perceive it heaving and swelling in the most unaccountable manner, as no wind was stirring. In an instant there appeared, at some small distance, a large body of water, rising as it were like a mountain. It came on foaming and roaring, and rushed towards the shore with such impetuosity, that we all immediately ran for our lives as fast as possible; many were actually swept away, and the rest above their waist in water at a good distance from the banks.
For my own part I had the narrowest escape, and should certainly have been lost, had I not grasped a large beam that lay on the ground, till the water returned to its channel, which it did almost at the same instant, with equal rapidity. As there now appeared at least as much danger from the sea as the land, and I scarce knew whither to retire for shelter, I took a sudden resolution of returning back, with my clothes all dripping, to the area of St. Paul’s. Here I stood some time, and observed the ships tumbling and tossing about as in a violent storm; some had broken their cables, and were carried to the other side of the Tagus; others were whirled around with incredible swiftness; several large boats were turned keel upwards; and all this without any wind, which seemed the more astonishing.
It was at the time of which I am now speaking, that the fine new quay, built entirely of rough marble, at an immense expense, was entirely swallowed up, with all the people on it, who had fled thither for safety, and had reason to think themselves out of danger in such a place: at the same time, a great number of boats and small vessels, anchored near it (all likewise full of people, who had retired thither for the same purpose), were all swallowed up, as in a whirlpool, and nevermore appeared.
Tappan (1914) also provided a detailed depiction of these events, shown in Figure 2.
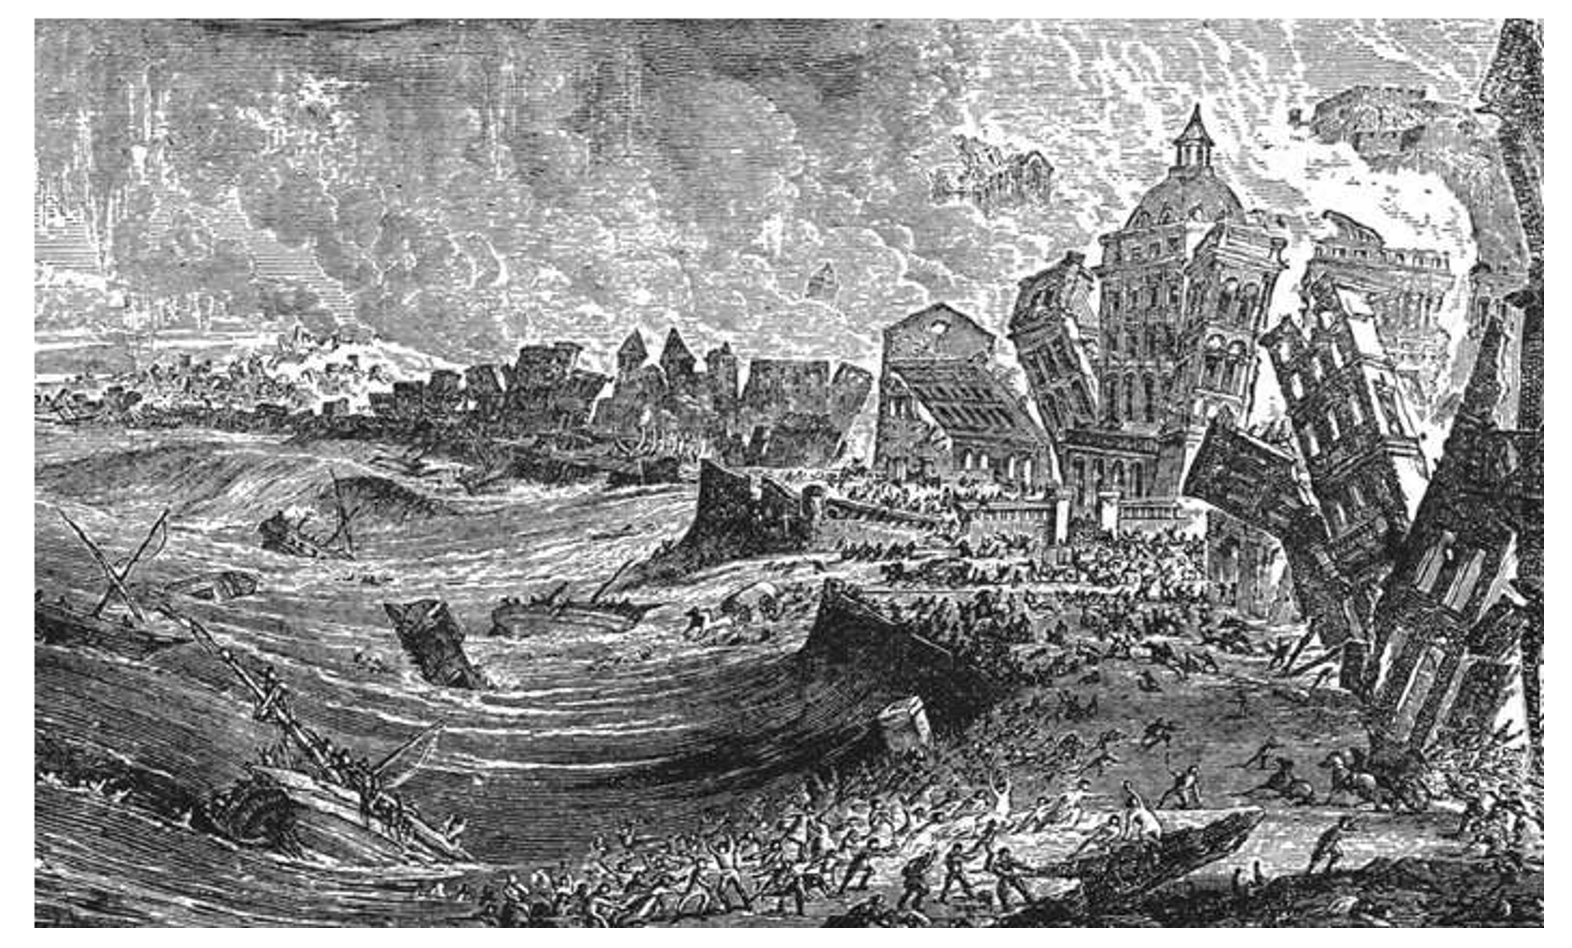
Figure2. 1755 Lisbon Earthquake Destruction; collapsing buildings, fires, and subsequent Tsunamis (Tappan, 1914)
Lisbon suffered from a third large shaking event that morning, somewhat less severe than the first two, but also accompanied by the dramatic sea effects that scientists now recognize as a tsunami. The earthquake toppled candles from church altars, igniting a citywide fire in Portugal as it soon spread to neighbouring houses and subsequently joined with other fires in kitchen chimneys. The inferno burned non-stop for the next six days.

The disastrous events of sea waves that drowned many, along with the terrible shaking, were noticed as far away as England and North Africa. They became the subject of many letters communicated to the Royal Geographic Society, a scientific fellowship of most eminent scientists formed in 1600, which still exists today (Davison, 1927). As well, both philosophers and religious leaders of the time were challenged to contemplate such natural phenomena and apply their most critical logic skills to understand their nature, which had previously been understood through faith or superstition alone. Thus, the Lisbon earthquake became popularly known as the first scientifically described earthquake of earlier times (Hough & Bilham, 2006).
During this period, the clergyman and natural philosopher John Michell (1724–1793) had already begun his scientific career in Queen’s College, Cambridge. At the age of 25, he developed a method of making magnets and created the inverse square law of magnetism (Michell, 1751). In 1757, he read Thomas Young’s, The History and Philosophy of Earthquakes, which contained abstracts of ten memoirs on the observed effects of the great Lisbon earthquake. After considering these sources, Michell moved away from the classical meteorological philosophy on earthquakes to suggest that earthquakes originated as an event at a specific location, such as where rocks appear broken and moved. Michell further posited that because of the earth’s elastic properties—following Hooke’s Law of 1660 that described the predictable behaviour of elastic materials such as springs—the earth could support the propagation of travelling wave forms. This would help explain how the Chinese seismoscope worked. He also suggested the origin of earthquakes as being a bursting of steam, due to highly heated subsurface water (Davison, 1927). Michell’s pioneering insights on earthquakes provided a foundation for future earthquake investigations.
Calabria (Italy) Earthquake (1783)
Just decades after the great Lisbon earthquake, another great earthquake happened in 1783, this time in Calabria, Italy. People within a two million square kilometer area felt it—six disastrous quakes in a row that killed 85,000 people. However, unlike the Lisbon earthquake, it was not famous for its devastation, but for the capable investigators at hand and those who carefully recorded the aftershocks (Davison, 1927).
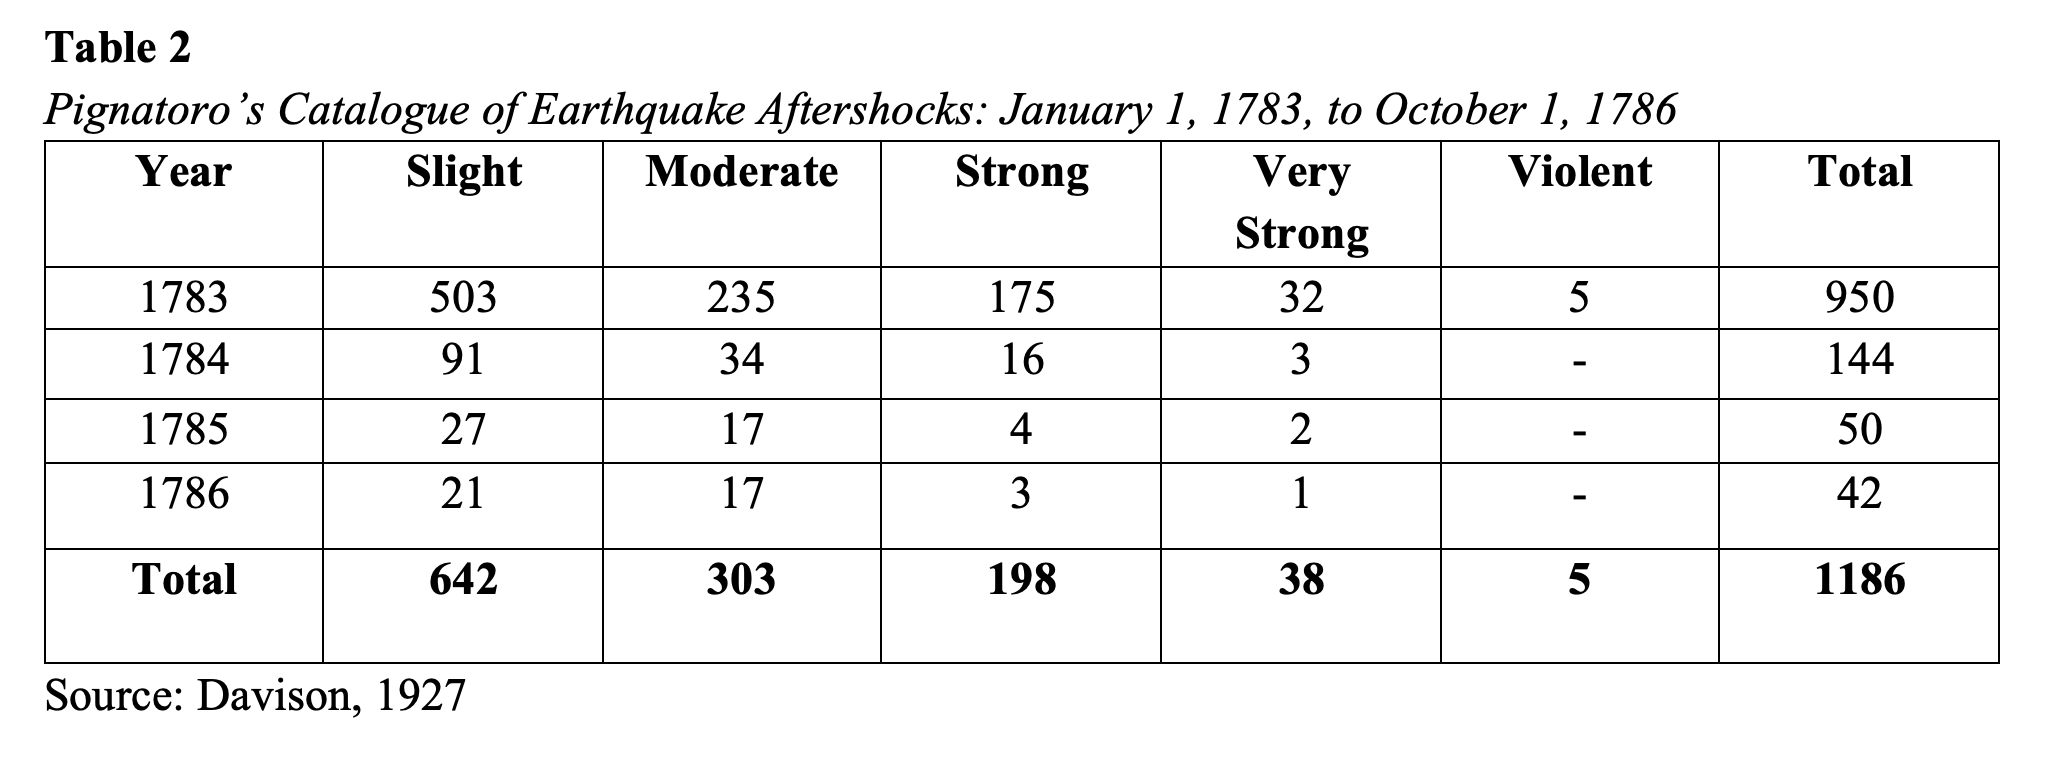
One investigator, Domenico Pignataro (1735–1802) of Monteleone, wrote the first article on the Calabrian earthquake and catalogued earthquake shocks during a period from January 1, 1783, to October 1, 1786 (Davison, 1927). Not only did he give the times of the 1,186 shocks, but he assigned to each a categorization in the form of a scale. This rough scale has five degrees (F’, F’’, F’’’, F’’’’ and F’’’’’) and is the earliest known attempt to construct a scale of earthquake shaking. He classified the shocks as slight, moderate, strong, very strong, and violent, denoting the “Force” of the earthquake (Table 2). Pignataro’s scale is thus one of the earliest expressions of a scale that describes the force of earthquakes as felt by witnesses.
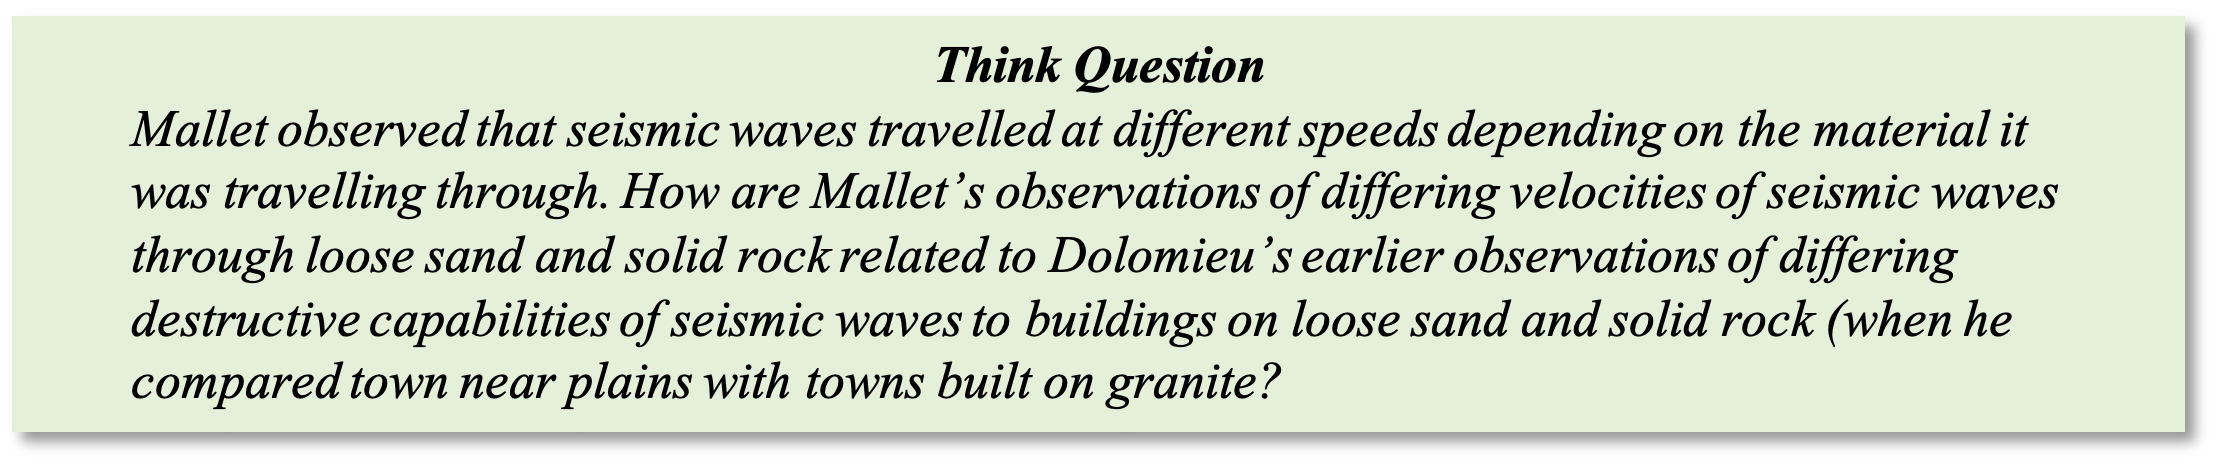
As Davison discussed (1927, Article 31) Deodat Dolomieu (1750–1801), who was another investigator that made further observations of the Calabria earthquake. He had a colourful youth in that he was condemned to death for killing a fellow soldier in a fight when he was 18, a sentence that commuted to nine months in prison. It was during this time he began studying the physical sciences. After his release he travelled to Portugal, Spain, Sicily, and the Pyrenees, developing an interest in earthquakes and their effects. In 1784, studied the Calabrian earthquake: He visited nearly all the towns on the province’s western coast, took excursions into the interior areas, and examined all the places ruined by the earthquake.
Notably, his account of the Calabria earthquake was less a record of disaster and more a study of the geological relations of the recorded series of earthquakes (Davison, 1927, Article 31). He was struck by how the local geologic characteristics either amplified or weakened the shaking of buildings, concluding that it plays a major role concerning earthquake damage. For example, buildings in towns established on unconsolidated sediment near the plain, which was dissected by deep ravines, were destroyed; houses in neighbourhoods that were built on the hard granite of the hills escaped with only slight damage. Though popularly known for his discovery of the mineral dolomite, named after him, his work supplemented that of his predecessor, Pignataro (Davison, 1927, Article 32).
Rhine-Netherlands Earthquake (1828)
The Rhine-Netherlands earthquake of February 23, 1828, was a rare, severely damaging seismic event. This region is now a central part of Belgium extending from the Lower Rhine Embayment to the North Sea (Figure 3). P. N. C. Egen (1793–1849), a mathematics and physics professor in Elberfeld, Germany, travelled to this western part of Germany to survey the damage caused by the earthquake (Varga, 2008). He based his survey on information from newspapers, oral accounts, and personal observations during his field visit, describing the damage caused by the earthquake, which he eventually recorded in his memoir. He went on to develop a scale of the effects of the shaking—that is, the intensity—and assigned integers to the different grades of the effects he had observed. This was the first attempt to characterize an earthquake using the damage it caused as an indicator of its intensity. Figure 3 shows Egen’s map of macroseismic observations after the 1828 earthquake; this is the first known map to show an intensity scale (in Camelbeeck et al., 2021).
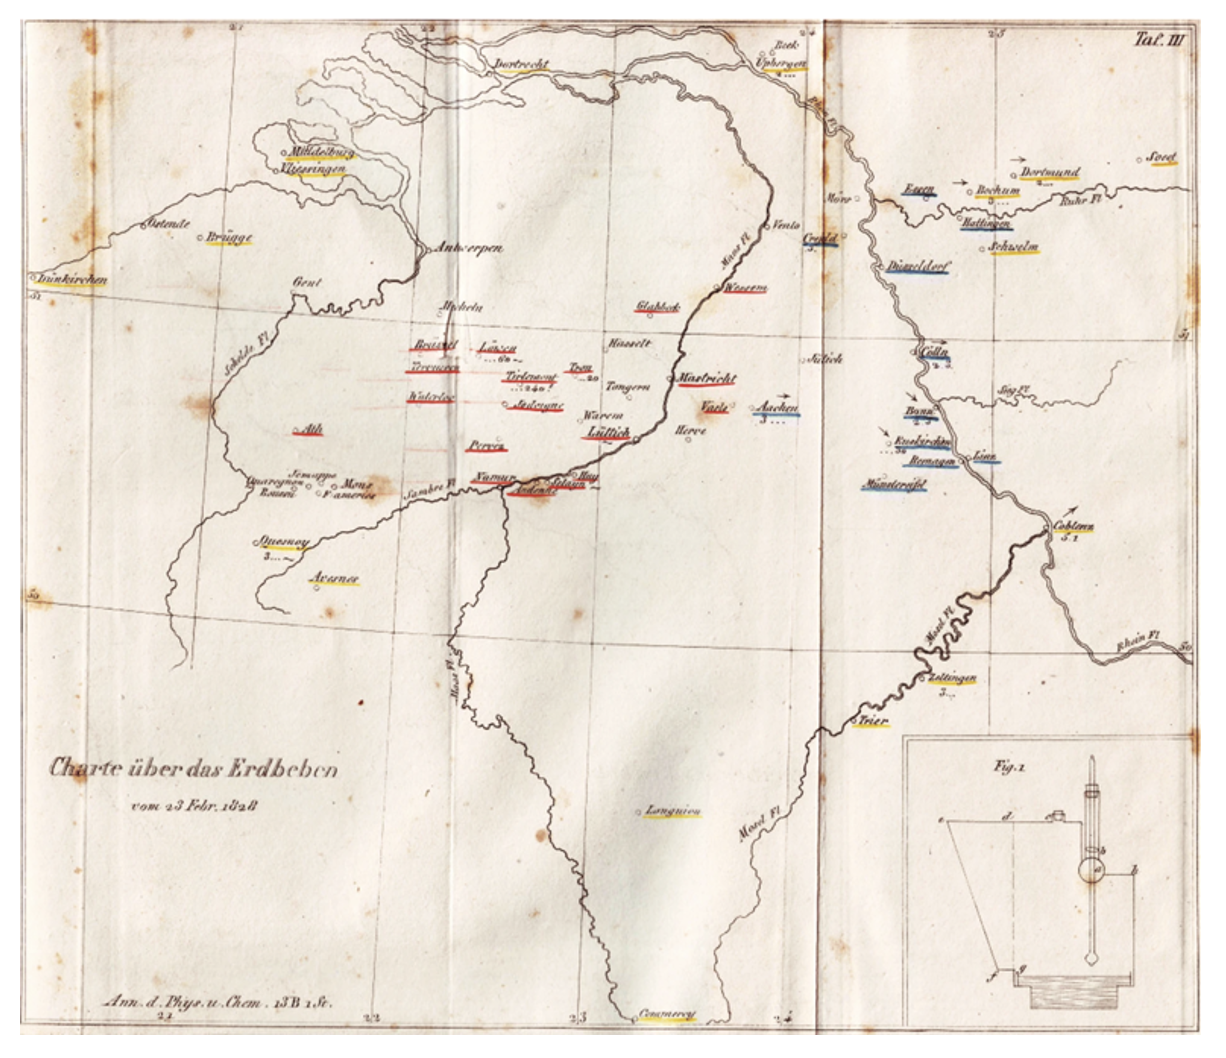
Figure 3. “Egen (1828) Macroseismic map of the February 23, 1828, earthquake. This is the first map worldwide that shows an intensity scale. Colored and underlined localities correspond to grades 5–6 (red), grades 3–4 (blue), and grades 1–2 (yellow). (Camelbeeck et al., 2021).
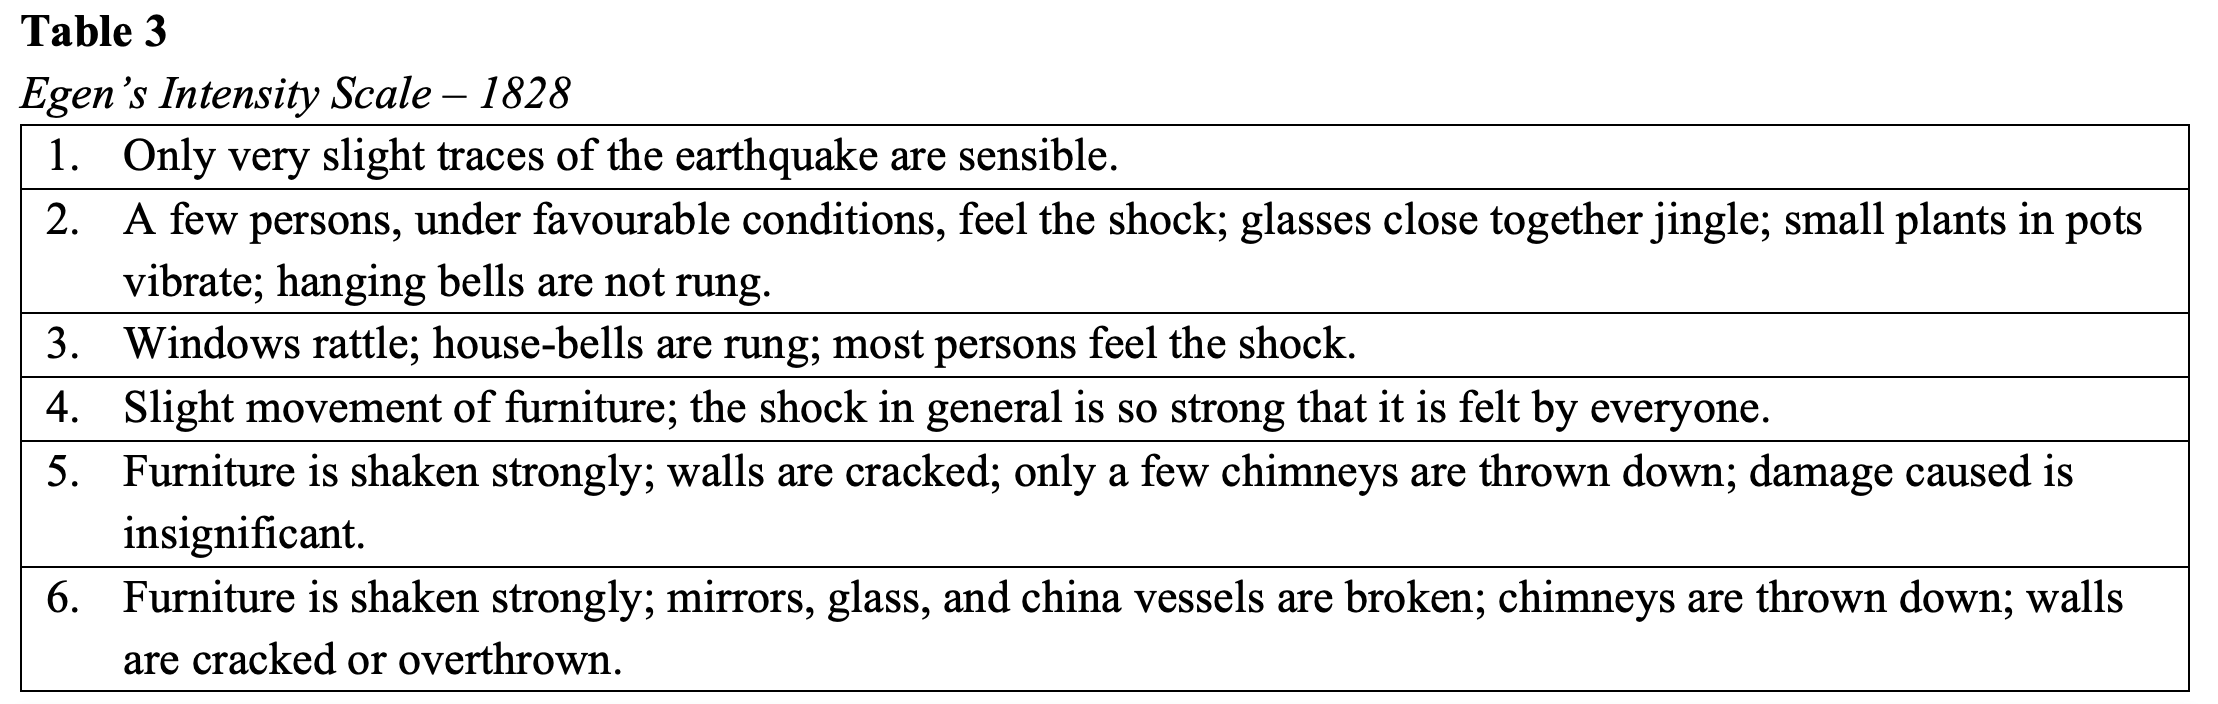
It is worth noting that scalar quantities in science are relatively similar, such as the Beaufort Wind Scale, developed in the 17th century. This is a scale of measurement based on observed effects rather than a physical parameter, like velocity. The integer quantity is assigned based on the observed data and means degree of observed phenomena, not a measured physical value. Egan’s scale follows a similar principle, as shown in Table 3.
The Rise of Technology: Observers Using Instruments
To this point, understanding about earthquakes has developed from information gathered directly by the human senses. The story changes here as technological advancements began to enhance the senses, revealing more data and allowing for further conceptualizations about the nature of earthquakes.
How the Problem of Spontaneous Pendular Motion Contributed to new ideas about earthquakes
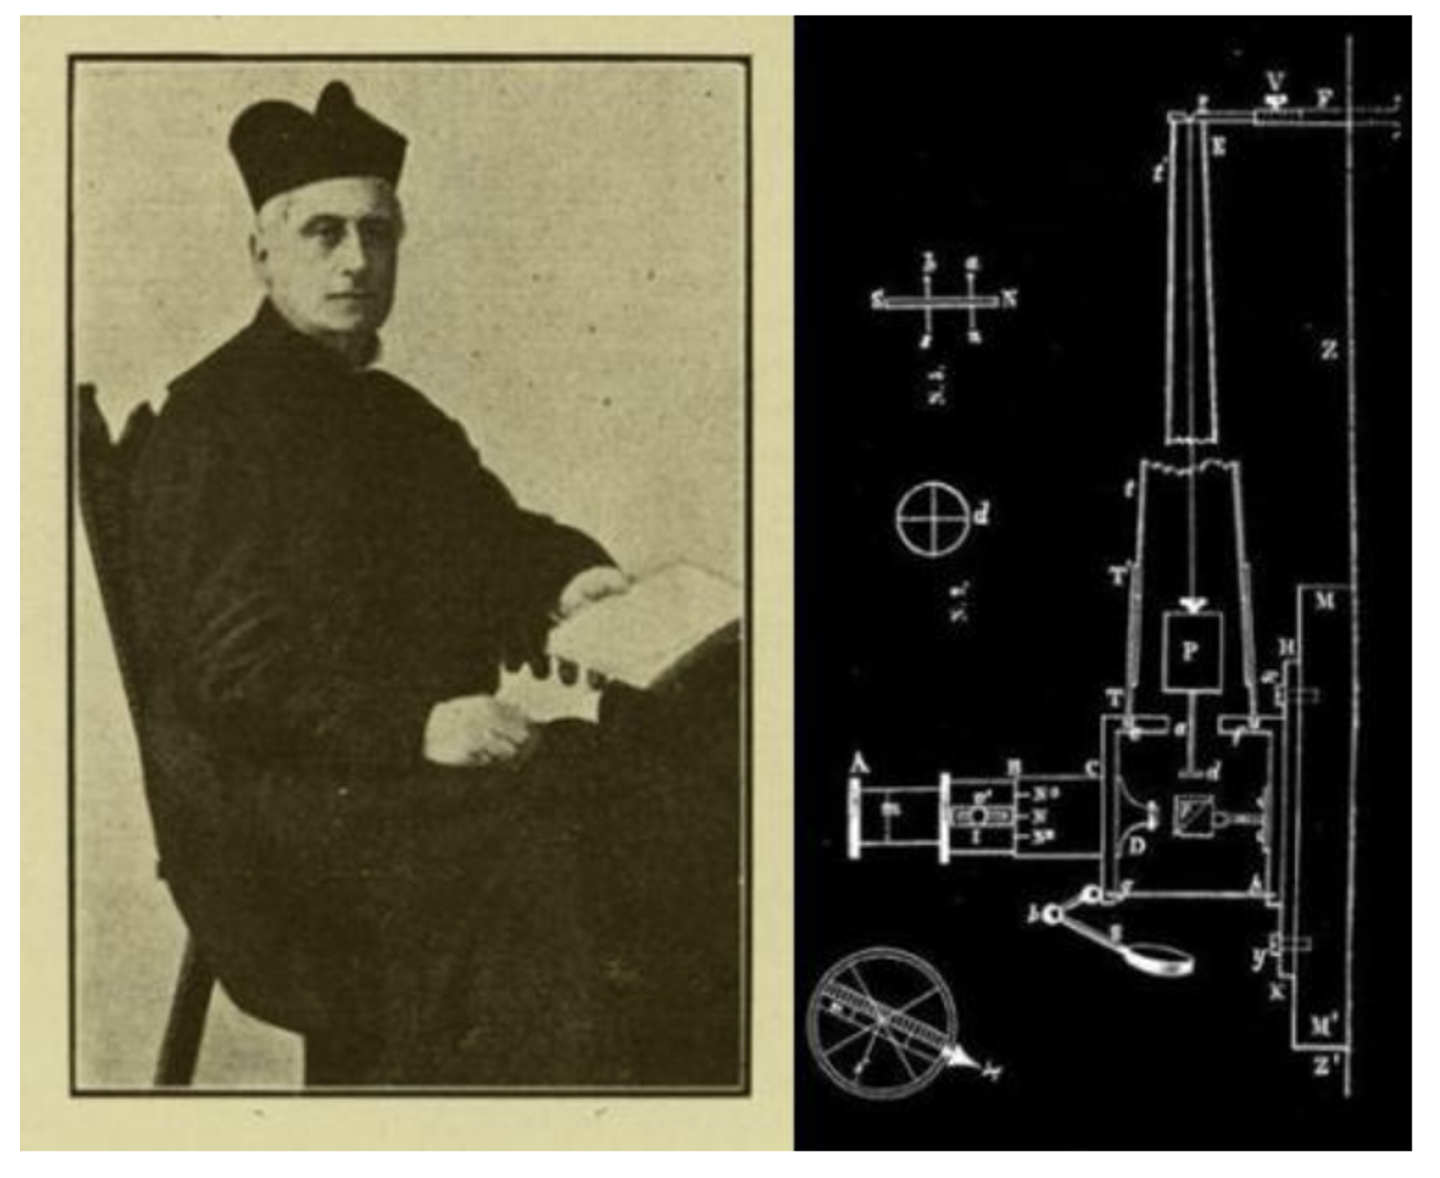
During the 1860s, Timoteo Bertelli (1826–1905) was a mathematician and a cleric in the Catholic church who lectured on mathematics and physics in the monasteries at Moncalieri and Naples, although in 1816 he transferred to the Collegio Della Querce, Florence, Italy, as Davison notes (1927, Article 91). There, he studied at length the spontaneous movements of the pendulum. While pendulum motion had been described since the time of Galileo (1564–1642), by Bertelli’s time, various explanations were proposed regarding the impetus for the phenomenon of spontaneous movements of the pendulum: wind action, the contraction and expansion of buildings under changes of temperature, and vibrations produced by passing vehicles (Davison, 1927, Article 91).
Davison (1927, Article 91) also described how Bertilli developed a unique pendulum that he used to study these seemingly spontaneous movements. His instrument was a ball of lead suspended from a stout arm driven into a wall at the college. Projecting downwards from the ball was a short rod that ended in a point. It was the motion of this point that Bertelli observed with a magnifying lens. He spent three years, from 1869 to 1872, conducting experiments and testing effects of pendulum movements in different locations and adjusting his instruments. In 1872, he erected an improved version of his instrument, a tronometer, on an isolated pillar in the basement of the college. A schematic of the tronometer is shown Using great patience and accuracy, he evaluated the amplitude of his pendulum swings. At the end of the third year, having made thousands and thousands of measurements from this self-designed instrument, Bertelli presented these conclusions:
1. The micro movements of an isolated pendulum often correlate with the occurrence of distant earthquakes.
2. Other movements occur during continued atmospheric air pressure depressions.
3. The movements have a maximum in winter and a minimum in summer.
These results were disputed by many, including a prominent Barnabite, Father Pietro Monte (1823–1888), who was the founder of the meteorological observatory in Leghorn, Italy. He did not believe these tiny motions could exist and move the pendulum. Gentle and courteous in manner, Bertelli influenced a wide circle by his character and enthusiasm. Today, he is regarded as the founder of microseismology (Davison, 1927, Article 92).
Pendulums and Earthquakes
Bertilli’s findings captivated another Italian geologist, Michele Stefano De Rossi (1834–1898), who sought to confirm his findings. He immediately set up an observation station in ancient burial caves excavated in the volcanic rock in Rome where the catacombs are and in his villa at Rocca di Papa (Davison, 1927). There, in one of the caves hollowed out of the side of an extinct crater of the Alban Mountains, De Rossi’s pendulums registered motions similar to Bertilli’s. He repeated and extended Bertilli’s observations and became firmly convinced of the reality of microseismic motions.

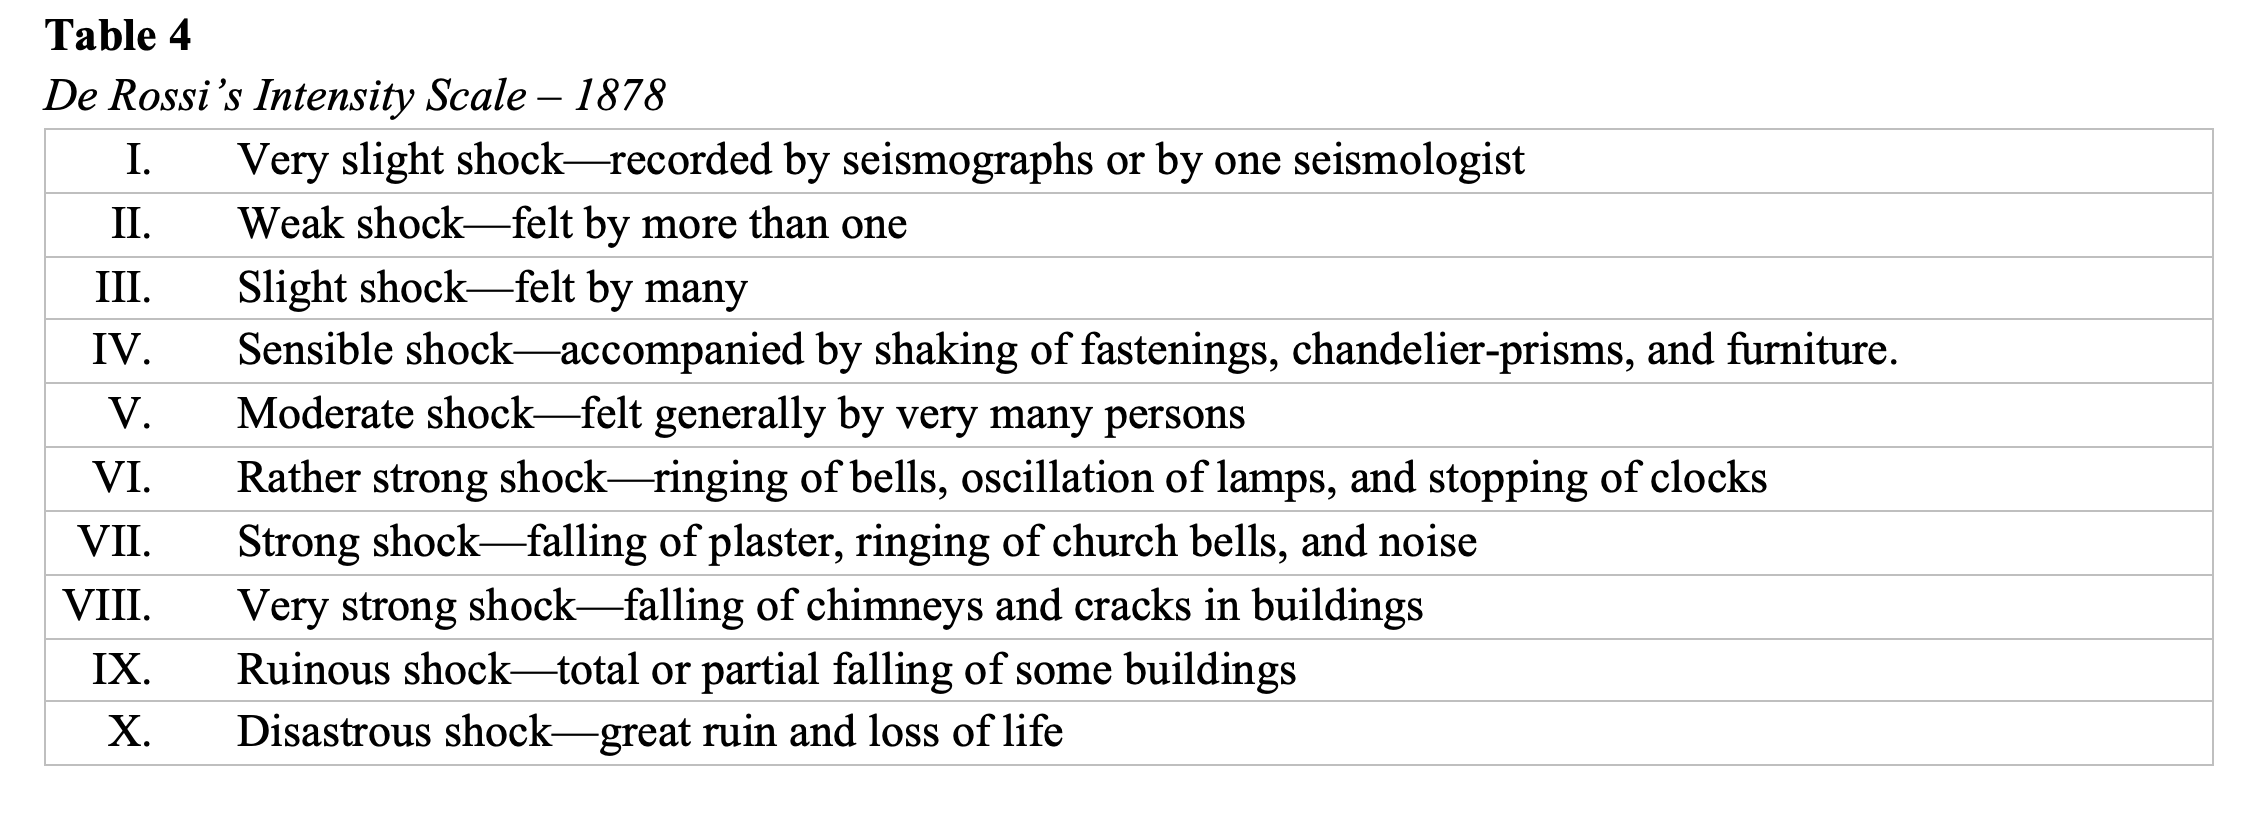
On January 19, 1873, another remarkable group of earthquakes occurred in the Alban Mountains near Rome. De Rossi investigated them in detail and then described then in his memoir, which earned him recognition as the leading student of Italian earthquakes. In the first volume of his Bullettino, De Rossi gave a list of the Italian earthquakes happening in the year 1873; in describing them, he aimed to specifically define every adjective he used. For examples, “strong shock” was explained as the falling of plaster, ringing of church bells, and noise (Davison, 1927). He sought to develop a scale to compare the amount of shaking of different earthquakes, which is shown in Table 4.
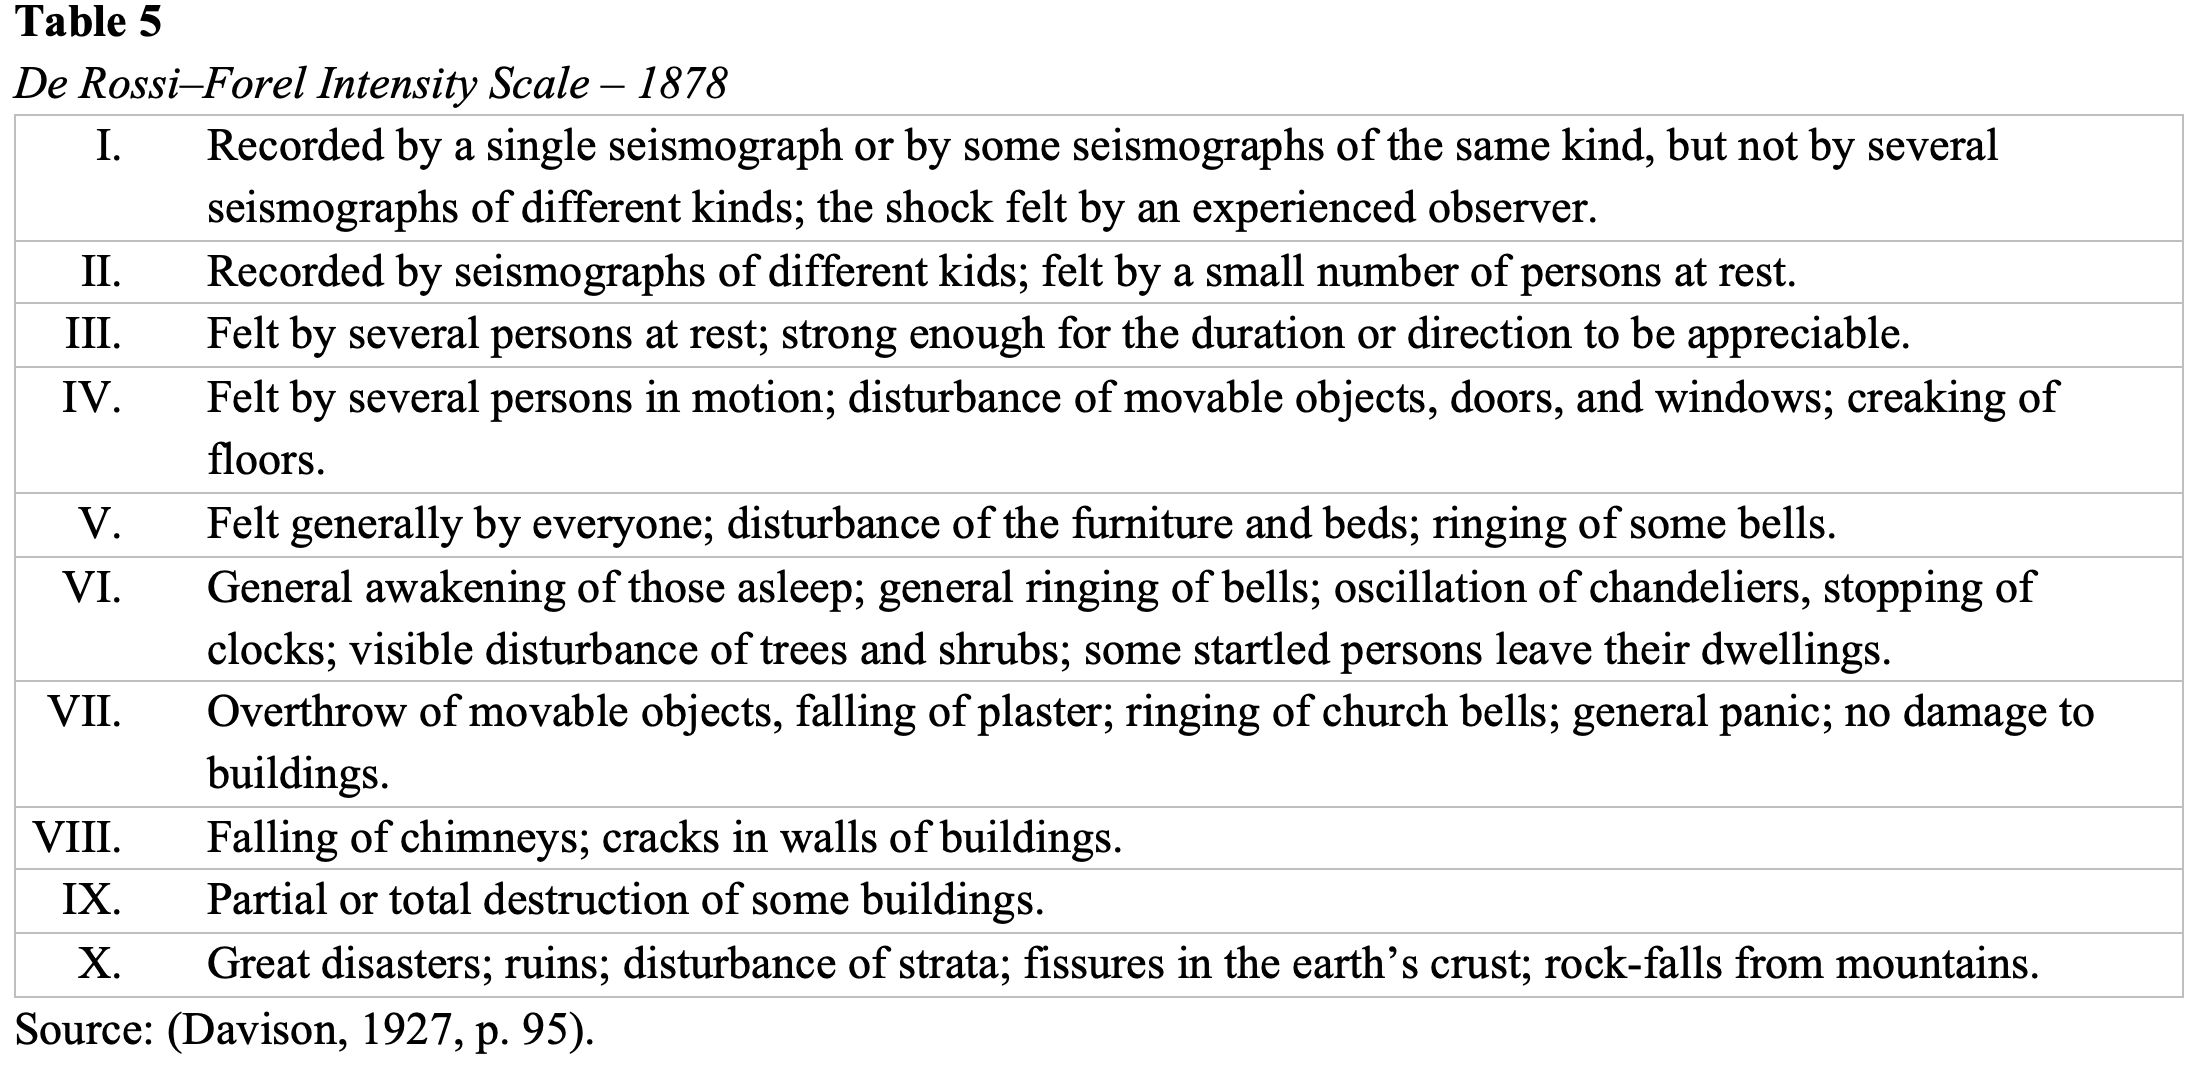
Meanwhile, in Switzerland, outside of Rossi’s knowledge and influence, limnologist François-Alphonse Forel (1841–1912) developed a similar seismic scale. When the two scientists became aware of each other’s work, their combined effort resulted in the De Rossi–Forel scale for determining the intensity of earthquakes, shown in Table 5 (Davison, 1927). De Rossi and Forel, however, were not the only ones developing scales to describe earthquakes in this manner, as we get to below.

Giuseppe Mercalli (1850–1914), an Italian volcanologist, visited all Italian earthquake sites during the years 1878 to 1891. He was especially interested in the Mount Etna eruptions, a volcano on the east coast of Sicily, about which he published a detailed account of its 1892 outburst. Mercalli sensed that a relationship existed between volcanism and seismicity, so he was also careful to record seismic disturbances in all the districts he visited. Thus, his interest in earthquakes grew as his study of volcanoes progressed.
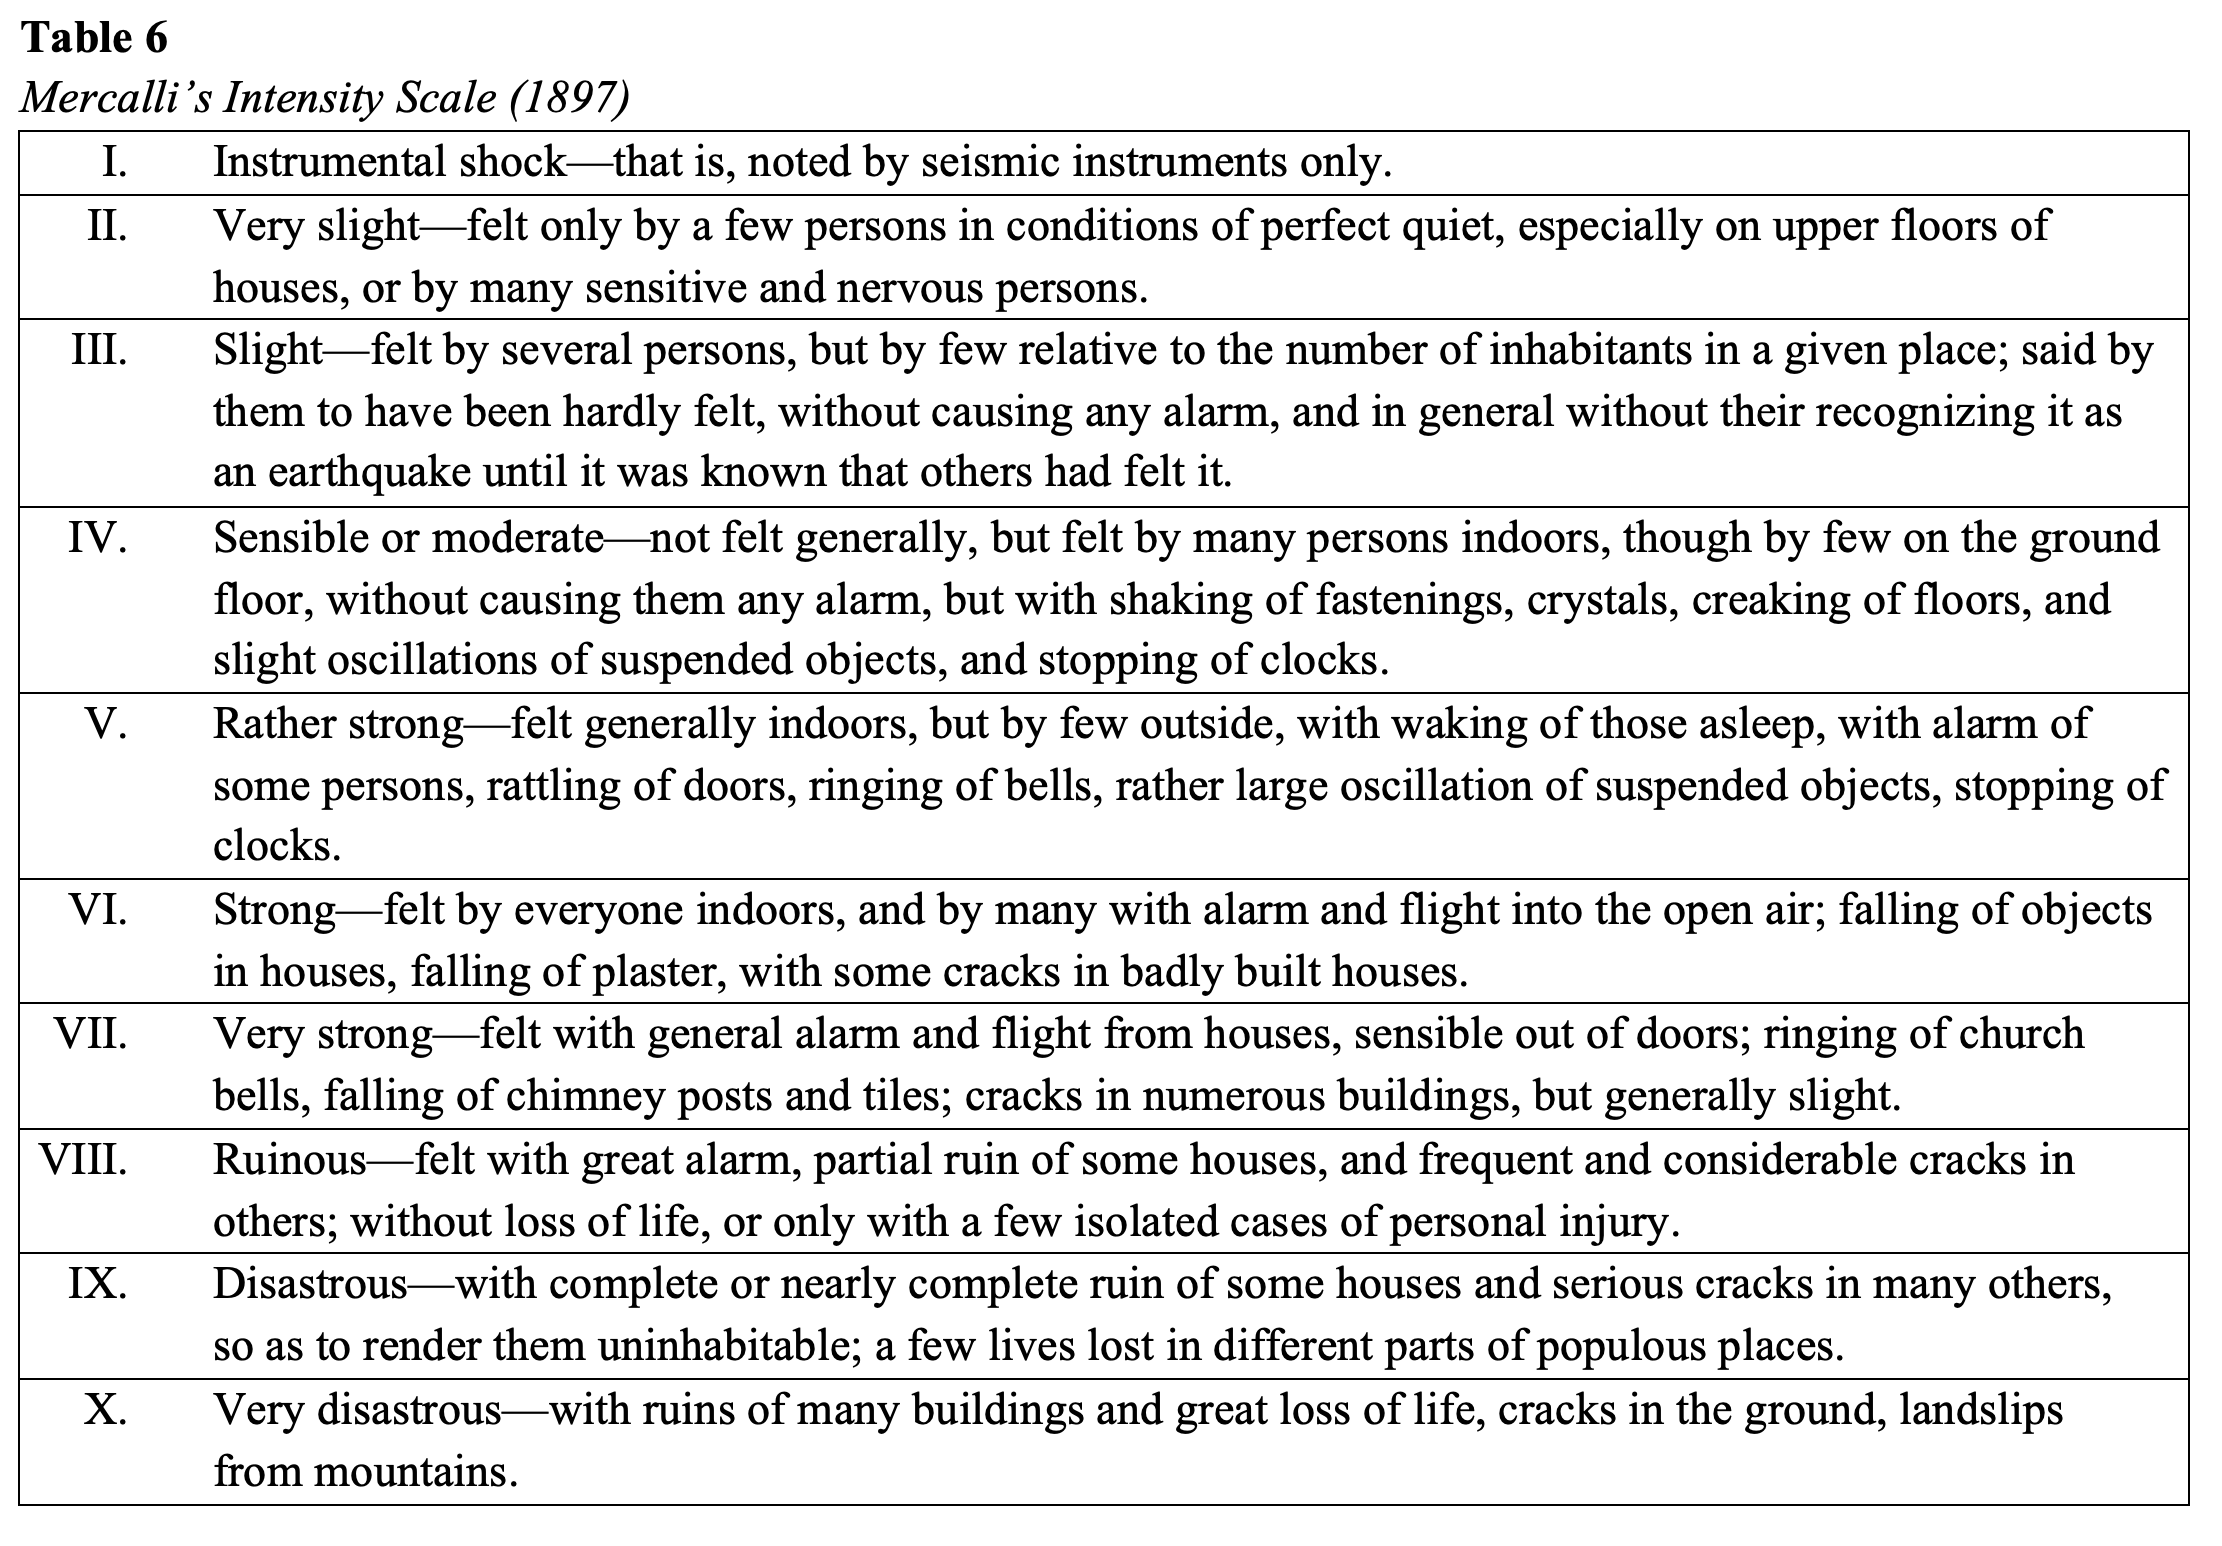
In 1883, Mercalli published his remarkable work, The Phenomena of Volcanoes in Italy [Vulcani e fenomeni vulcanici in Italia], with the first part (pp. 1–215) on volcanoes and the second part (pp. 216–367) devoted to the earthquakes and their distribution in time and space. The catalogue of Italian earthquakes (pp. 219–332) was one of the earliest and most successful attempts to chronicle the earthquakes of Italy as a whole, from 1450 BCE to 1881 CE. As an earthquake investigator, Mercalli soon realized the usefulness of the De-Rossi-Forel intensity scale in describing the effects of earthquake damage (Davison, 1927). In 1887, while studying the Riviera earthquake, Mercalli determined that the higher degrees of Rossi-Forel scale were insufficient to discriminate various amounts of damage. He modified the scale and proposed a final form in 1897, which is shown in Table 6, which was designed for use in countries experiencing strong earthquakes. This scale perhaps sparked the idea of different regional intensity scales that were about to emerge, based on different geologies in the world. This scale was subsequently adopted by the Central Office of Metrology and Geodynamics in Rome.
A New Idea: Absolute Intensity
During the late 19th century, Adolfo Cancani (1856–1904), another Italian geologist, suggested that the intensity of an earthquake is evident in how quickly or slowly the earth moves during the event—this variable is the measure of force involved in the earthquake. In other words, maximum acceleration during an earthquake is the force intensity of an earthquake. Moreover, increased destruction is linked to increased acceleration.

In 1904, Cancani suggested an absolute scale of intensity similar to Mercalli’s scale; however, he added two degrees to represent the highest of all intensities. The maximum acceleration (mm/s2) corresponding to the 12 unique degrees on the intensity scale are as follows: 2.5, 5, 10, 25, 50, 100, 250, 500, 1000, 2,500, 5,000, and 10,000. Cancani called the scale “Absolute Intensity” (Davison, 1927).

Measuring the Speed of Seismic Waves
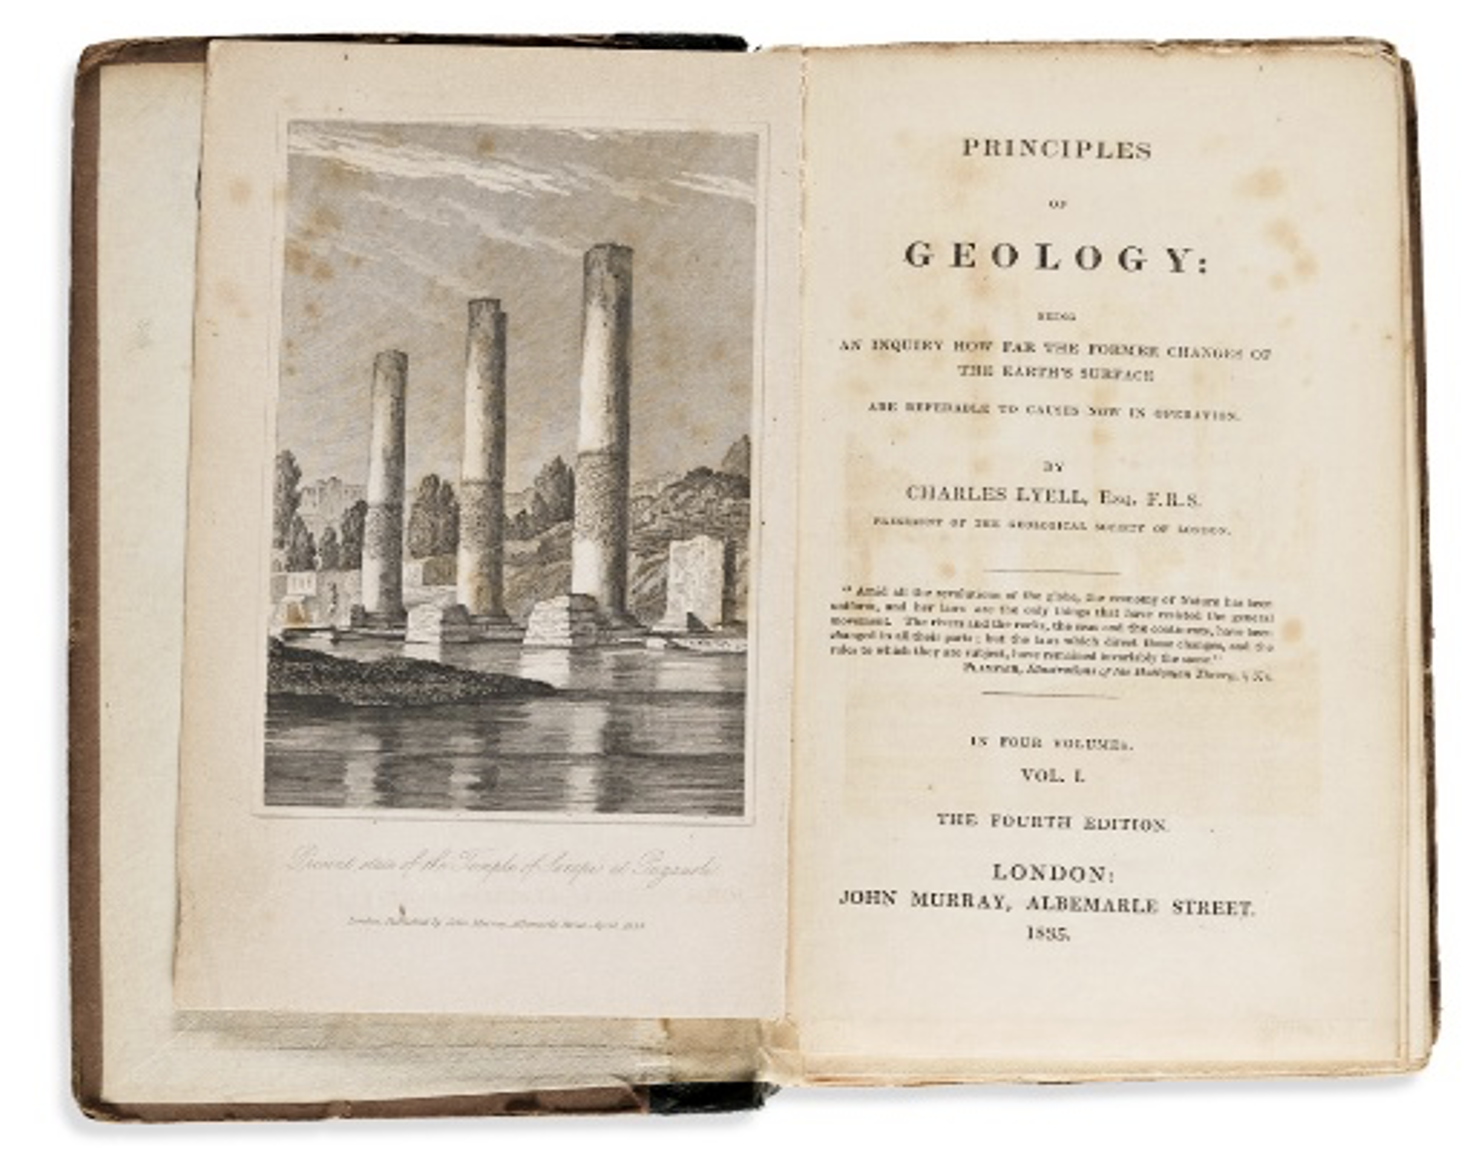
Happening in parallel with the previous work, another important development began to unfold about 50 years prior to Cancani’s Absolute Scale, in the work of Robert Mallet (1810–1881). When Mallet read Charles Lyell’s (1797–1875) very famous book, Principles of Geology, he noticed something of interest in the well-known diagram of a set of pillars from the 1783 Calabria earthquake (Davison, 1927), as shown in Figure 5. In particular, he observed that the upper parts of the pillars had been twisted, without being overthrown, by the Calabrian earthquake.
He immediately realized the flaw in the common understanding that independent rotary movement must occur under each pillar. Instead, he posited that the rotary movement is due to friction, in combination with the inertia of the squared stone in front of the pillars. Based on this, Mallet was convinced that better understanding the mechanics of earthquakes could provide more protection from their devastating effects.
Thus, in October 1849, Mallet undertook the first human experiments to understand ground motion during earthquakes by measuring the velocity of the waves. He went to Killiney Beach, Ireland, with his son John, equipped with a few pounds of gunpowder, a shovel, a half mile of electric wire, a battery, a clock, pen, paper, and a seismoscope in the form of a bowl of mercury. He buried the gun powder and used the wire and battery to control the timing of the powder detonation a half a mile away. Mallet formed a crosshair on the surface of the mercury by using a projector and a focusing lens. He observed the crosshair through a small telescope. When the wave hit the mercury bowl, the surface was agitated, and the image lost focus and disappeared. From these experiments, he determined the rate of travel of seismic waves in sand (825 feet per second), solid granite (1, 655 feet per second), and quartzite (1,162 feet per second) (Davison, 1927).
In his 1846 paper for the Transactions of the Royal Irish Academy, Mallet described the nature of earthquake motions as follows:
An earthquake is the transit of a wave or waves of elastic compression in any direction from vertically upwards to horizontally, in any azimuth, through the crust and surface of the earth, from any centre of impulse or from more than one, and which may be attended with sound and tidal waves, dependent upon the impulse and upon circumstances of position as to sea and land. (pp. 75-76, original emphasis)
This publication marked the beginning of instrumental measurement of the elements of earthquake motion. The first element Mallet measured was the rate of transmission or velocity in which waves travel from place to place.
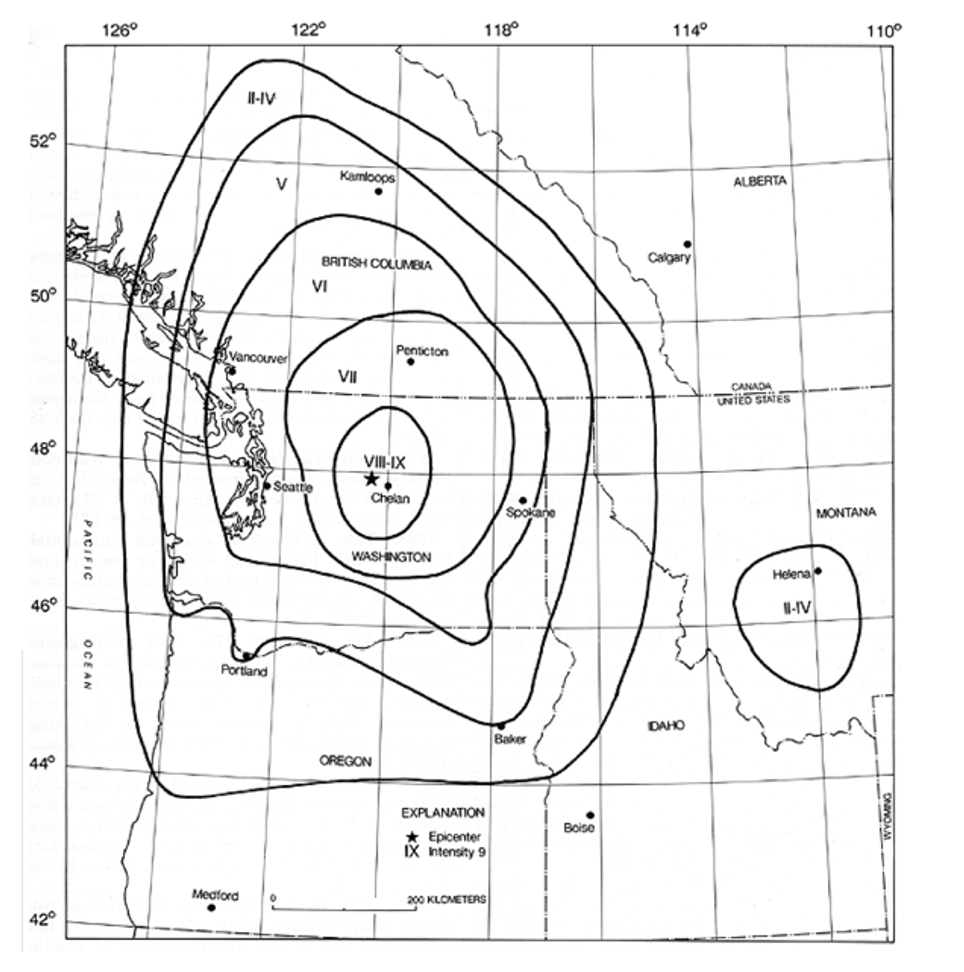
In 1862, Mallet developed an intensity scale that described the shaking of the Neapolitan earthquake of 1857. Mallet’s intensity scale was for this single earthquake throughout the affected areas. While describing the Neapolitan earthquake, Mallet created maps that used lines to connect locations of similar intensity, or the amount of the damage in the earthquake affected area. He called this an isoseismal map, which is shown in Figure 6 and manifests a bull’s-eye pattern. Mallet also introduced several terms familiar to modern seismologists, such as isoseismal, seismic hypocentre, which is the location in the crust where the earthquake happens—and meizoseismal area.
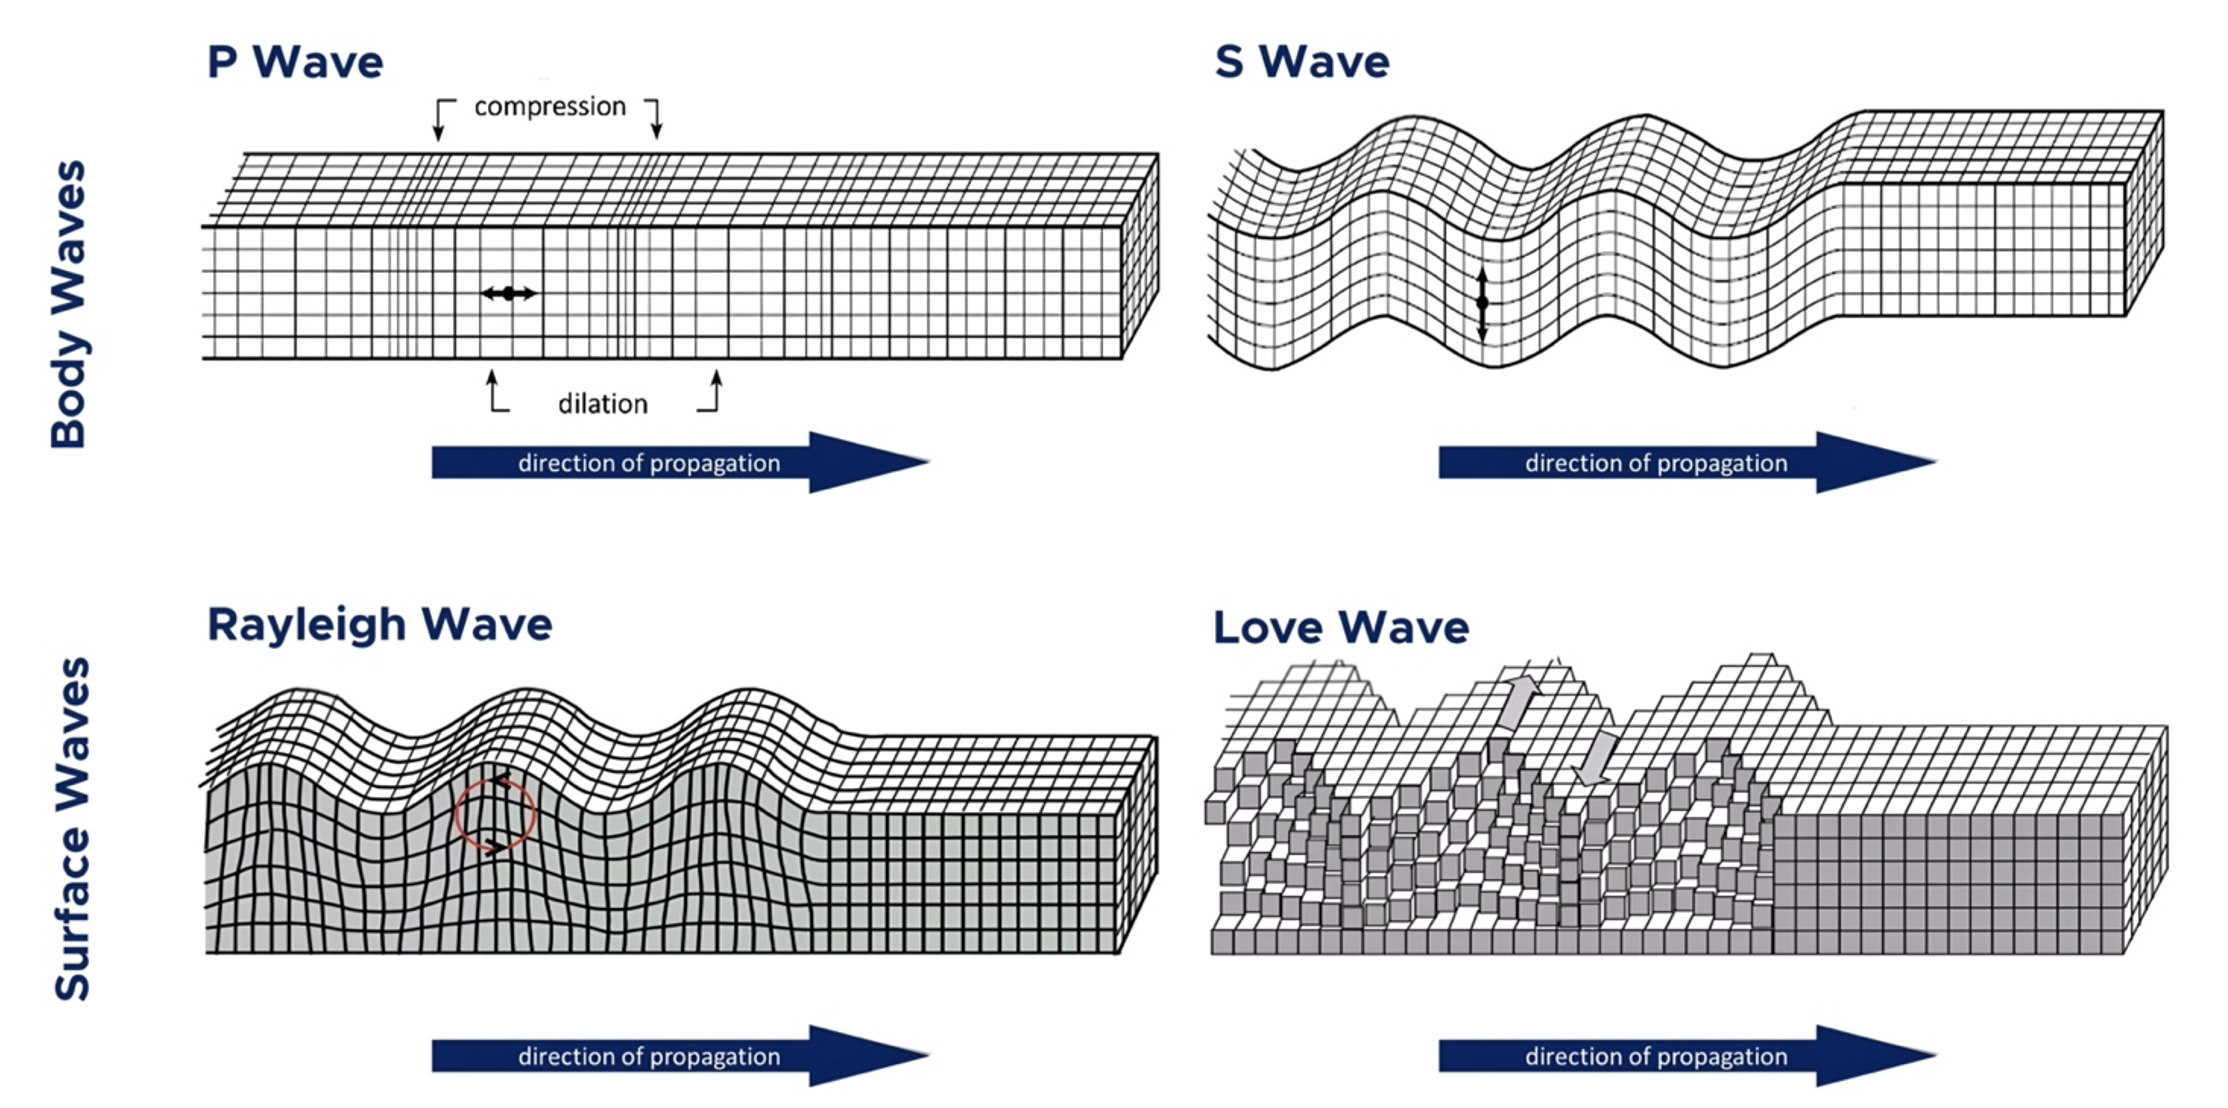
A practical engineer of Dublin and later of London, Mallet discussed earthquake waves in classical mechanics by drawing parallels between the earthquake waves and sound waves. His experiments and discoveries made a significant contribution to this field, inspiring future thinkers, such as Richard Oldham (1858–1936), who was the first to provide clear evidence for P-waves, S-waves, and surface waves in earthquakes in his landmark 1906 report on the 1897 Assam, India, earthquake (Oldham, 1906). Others would also designate new kinds of seismic waves: In 1855, Lord Rayleigh (1855), predicted the existence of surface waves that roll along the ground,; in 1911, Augustus Edward Hough Love (1911) demonstrated the existence of certain surface seismic waves, that cause horizontal shifting of the earth during an earthquake in 1911. All these wave patterns are shown in Figure 7.
Developing a Standard Measure for Earthquakes: Creating the Richter Scale
Charles Francis Richter (1900–1989), born near Overpeck, Ohio, was an excellent student growing up and went on to receive a PhD in quantum physics. This led to a job at the new Seismological Laboratory in Pasadena, founded in 1927. Richter’s focus was theoretical problems, but he soon discovered the necessity of observational data for doing fruitful research (Hough, 2007). When Professor Beno Gutenberg (1889–1960), a well-known seismologist from Germany arrived at the lab in 1930, they collaboratively produced a long series of joint papers. They also produced a book, Seismicity of the Earth (Gutenberg, & Richter, 1941), which is a culmination of their previous work.
While working in Pasadena, Richter recalled that during Robert Mallet’s Day, distribution of macroseismic effects of earthquakes could only be represented by drawing lines of equal apparent intensity of shaking, or isoseismals. This was evident in the bull’s-eye pattern in the map in Figure 6. The highest intensities—those with the most damage—occurred towards the centre of the pattern, with damage decreasing with distance from the earthquake epicentre (Hough, 2007). After spending many days at a seismological station creating an inventory of earthquakes registered at various local seismic stations, Richter noted the discrepancy between people’s subjective, excited or alarmed responses to an earthquake and its actual character as indicated by seismometers. He asserted, “A small shock perceptible in Los Angeles metropolitan centre will set the telephone at Pasadena laboratory ringing steadily for half a day. At the same time, a major earthquake under some remote oceans passes unnoticed except for seismograph readings and rates only a line or two at the bottom of a newspaper page” (Richter, 1958, p. 340).
In 1931, the Pasadena Center issued its first inventory of earthquakes in southern California. Richter knew that listing 200 to 300 such shocks in a year in terms of intensity was hardly possible. Many of the shocks were not reported as felt, and some obviously large ones were reported only as barely perceptible at points distant from the epicentre, which might be in a thinly populated desert or mountain area, or off the coast. Richter believed another way to characterize earthquakes should be found to compare them directly with one another, so he developed a plan to standardize size or strength of an earthquake, regardless of where a person in relation to its occurrence (Hough, 2007).

Using Wave Amplitudes to Measure Earthquake Size
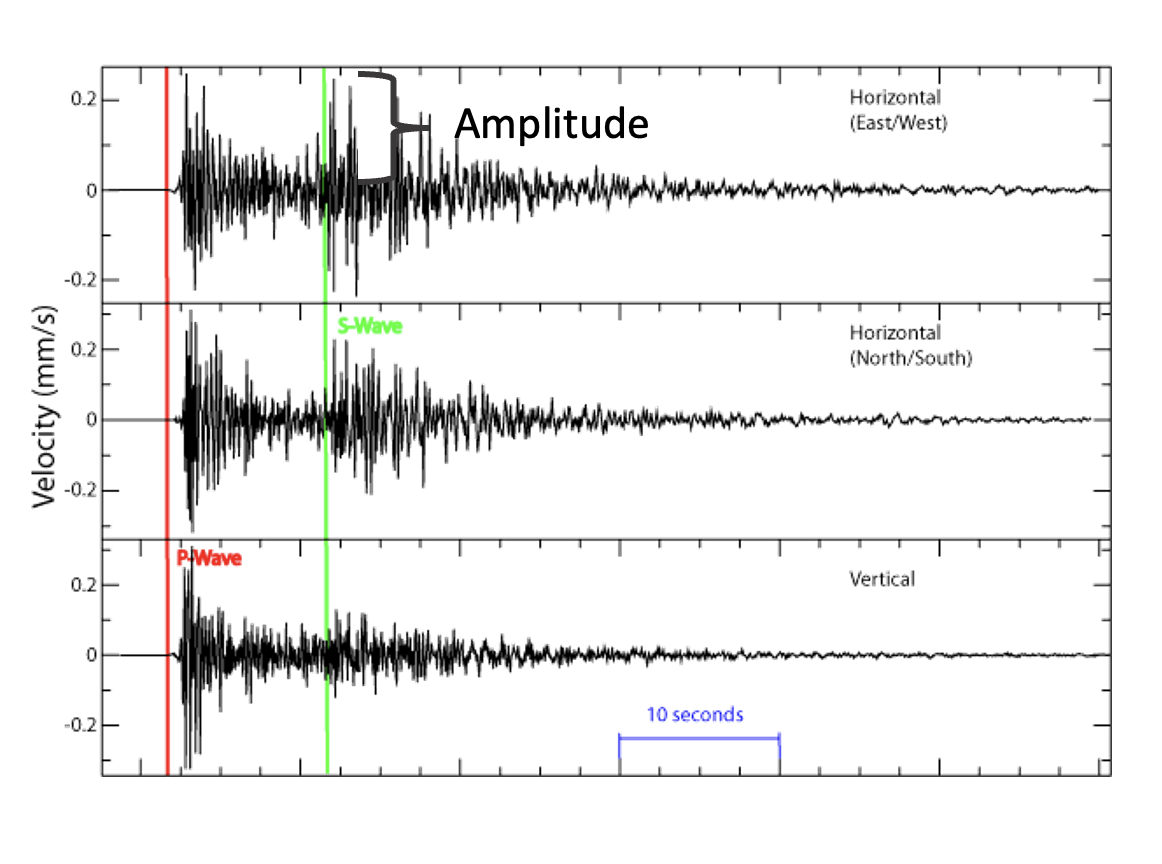
Richter was inspired by the research of the Japanese seismologist Kiyoo Wadati (1902–1995) (Hough, 2007), who had demonstrated the relation between maximum surface wave amplitude as seen on a seismogram, and epicentral distance for earthquakes in Japan (Richter, 1935). Figure 8 shows an example of this seismographic data. When Richter read Wadati’s work, he realized that listing the size of earthquakes based on maximum seismic wave amplitude would be useful. He thus set about developing a scale of absolute values that he could use to directly compare the size of earthquakes in southern California.
For the immediate practical purpose of cataloguing southern California earthquakes, Richter considered that all stations equipped with the torsion seismometers were similarly calibrated so that their readings would be consistent with each other. Thus, all instruments would have the same magnification for the ground motion of the same character. The point was to reduce the number of variables, leaving only the size of the earthquake, so they could be directly compared with one another.
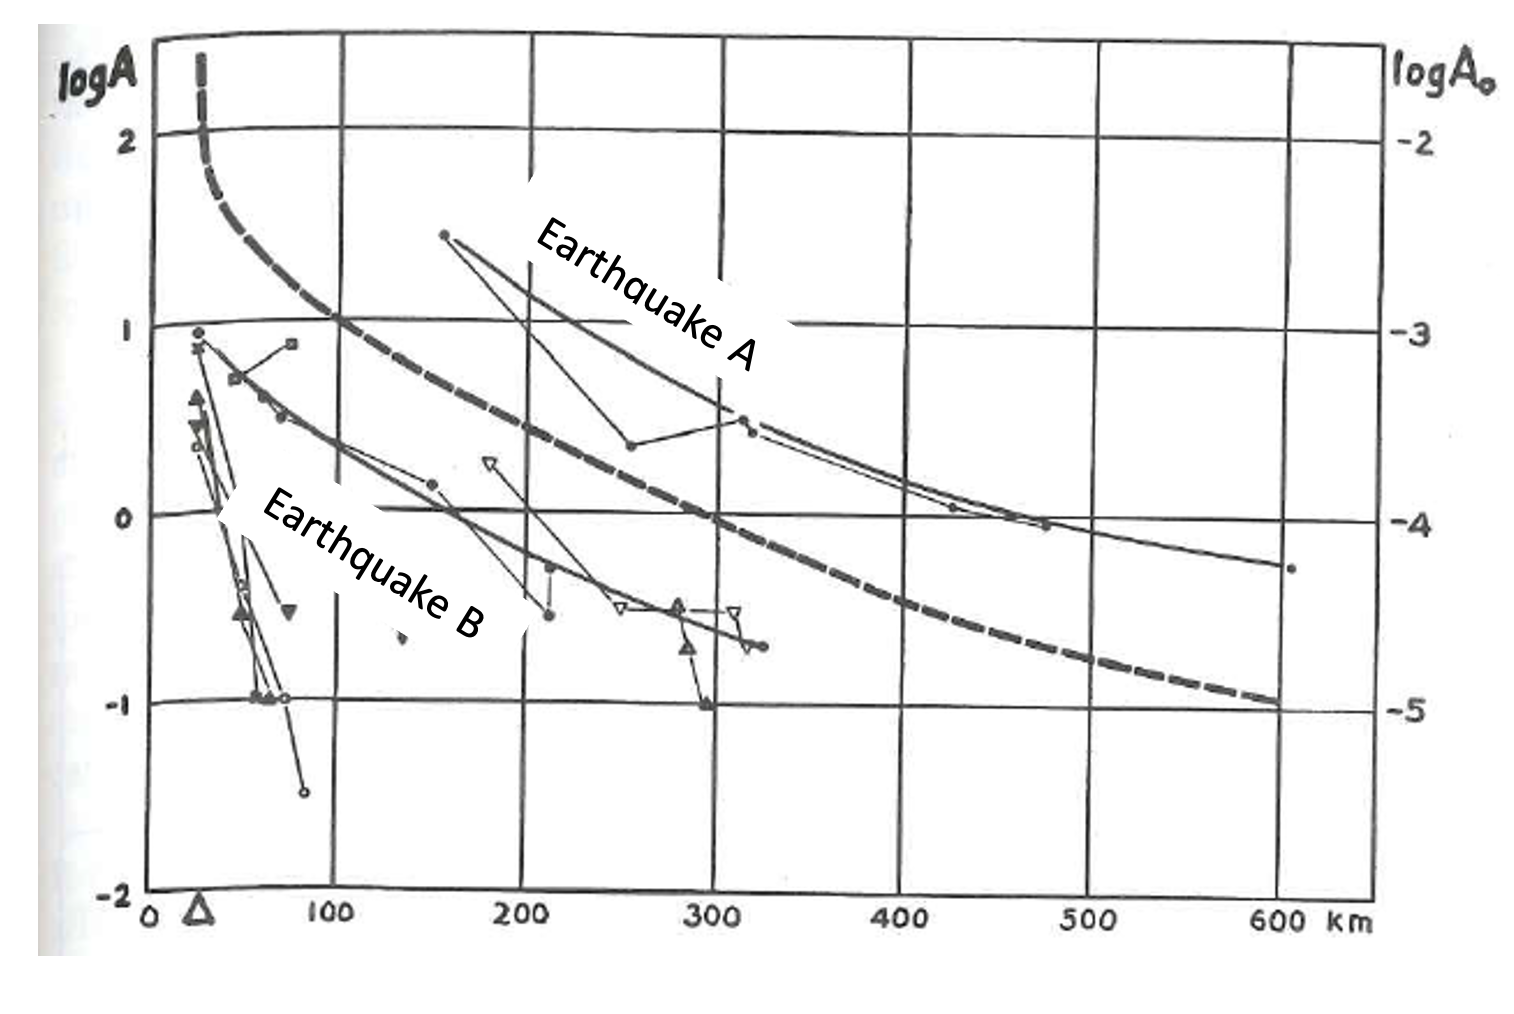
Controlling for as many variables as possible, Richter began documenting amplitude records of southern California earthquakes, including their distance from each seismic station. He considered two earthquakes—earthquake A and earthquake B, as shown in Figure 9—which had the exact same source distance and were recorded at the same stations. He assumed that the larger earthquake should record larger seismograms than the smaller one at any one station. If the epicentres differed, the smaller shock could appear as a larger seismogram at given station if it was markedly closer to it. Accordingly, the general procedure was first to determine the epicentre for each shock. Then he would plot the maximum ground motion at each station, as aligned with the corresponding epicentral distance from each of the recording stations; this amplitude would decrease with distance from the epicentre. By plotting the two curves for different earthquakes, one curve will likely be higher than the other, indicating that it was the larger event. This is evident in Figure 9.
Richter plotted the curves based on trace amplitudes measured directly on the seismogram. However, he realized that the measurements range from 0.1 mm to 12 cm. Therefore, Richter plotted the amplitudes on a logarithmic scale; this gave him a more manageable chart than a linear scale. Moreover, he was now able to state the results numerically. Figure 9 thus shows logarithmic plots for the data of observed
earthquakes. Log Amplitude (log A) is along the left axis, which is the log of the recorded trace amplitudes for each observed earthquake at a given distance, as recorded by the Wood-Anderson seismometer. It was important to note the type of seismometer, because different seismometers recorded seismic waves a little differently. Keeping a standard type of seismometer kept one more variable constant. Of note, the representative curves of seismic wave amplitude versus distance are roughly parallel to each other, with amplitude decreasing as distance increases. The dashed curve represents a hypothetical curve that, most importantly, passes through a log A of 1 and distance of 100 km. This hypothetical curve shows the trend of decay of amplitude with epicentral distance.
Richter’s development of the concept of earthquake magnitude grew out of his childhood interests in both astronomy and science fiction. In particular, astronomy informed the choice of “magnitude” for his scale in that the apparent magnitude of a star is the brightness of that star as it appears to an observer. When stargazers look at the night sky, they see some stars as brighter than others, based on both the star’s brightness and its distance away. Richter’s scale of earthquake magnitude is analogous to the absolute magnitude of the brightness of a star, which is the star’s brightness to an observer from a standard distance of 10 parsecs, or 3.26 light-years away (Bonham, 2021); on the other hand, apparent magnitudes, compares to the earthquake intensity scales. It is also analogous to the pH scale used to measure acidity, because pH is a logarithmic measure of the hydrogen ion concentration in a solution. Logarithmic scales also appear for acoustics in the form of decibels (Richter, 1958, p. 340–341).

In Figure 9, a log A0 can be seen on the right axis of the graph. This axis reflects a shift in the scale for a particular earthquake—what Richter called a near-zero earthquake—selected as a standard earthquake. A near-zero earthquake was one that would be imperceptible except with a seismometer at the epicentre. Richter reduced the recorded amplitudes (log A) to an acceptable amplitude (M) that would have been recorded at a standard distance of 100km from the epicentre. This can be compared to the absolute brightnessof a star at a standard distance from the observer. Richter’s magnitude was, therefore, the difference between the recorded log amplitude (log A) andthe standard log amplitude of a “near zero” earthquake (log A0). Richter,therefore, defined the quantity M (Richter Magnitude), as follows:
M =log A – log A0
Developing a Truly Universal Measure for Magnitude
Richter magnitude became very famous and was used pervasively to refer to the size of earthquakes, but problems are immediately evident when trying to use it in places other than southern California, as well as for earthquakes larger than M6 or M7. Because the measurement of waves is dependent on the kind of seismometer doing the measurement, and not all locations had the same kind of seismometer, inconsistencies were introduced into the measurements. Further, seismic waves behave differently depending on the geology, as discussed earlier in the section about Dolomieu and southern California had its own distinct geology compared to the rest of the world. As a result, researchers noticed a lot of uncertainty in the measurements. Thus, many seismologists created their own local magnitudes (ML), since these magnitudes vary; however, this does not resolve the core issue of directly comparing one earthquake against any other earthquake. Despite the almost ubiquitous use of Richter Magnitude, even today, a new approach was needed.
Seismic Moment or the “Work Done” as a Measure of Earthquake Size
Knowledge and scholarship about earthquakes developed over the centuries as this review illustrates, but one earthquake really took this study to new heights: the great San Francisco earthquake of April 18, 1906. This earthquake—and Harry Reid’s reporting and analysis of its displacements and strain in the surrounding crust (Reid, 1910)—provided the foundation for a different approach to comparing earthquakes, one that began several decades earlier than Gutenberg and Richter’s work. The sheer size of the fault, which ruptured the northernmost 296 miles (or 477 kilometers) of the San Andreas fault from northwest of San Juan Bautista to the triple junction at Cape Mendocino, was stunning. More importantly, it confounded contemporary geologists with its large, horizontal displacements and great rupture length. Indeed, the significance of the fault and recognition of its large cumulative offset would not be fully appreciated until the advent of plate tectonics more than half a century later.
A New Mechanism for Earthquakes: Elastic Rocks?
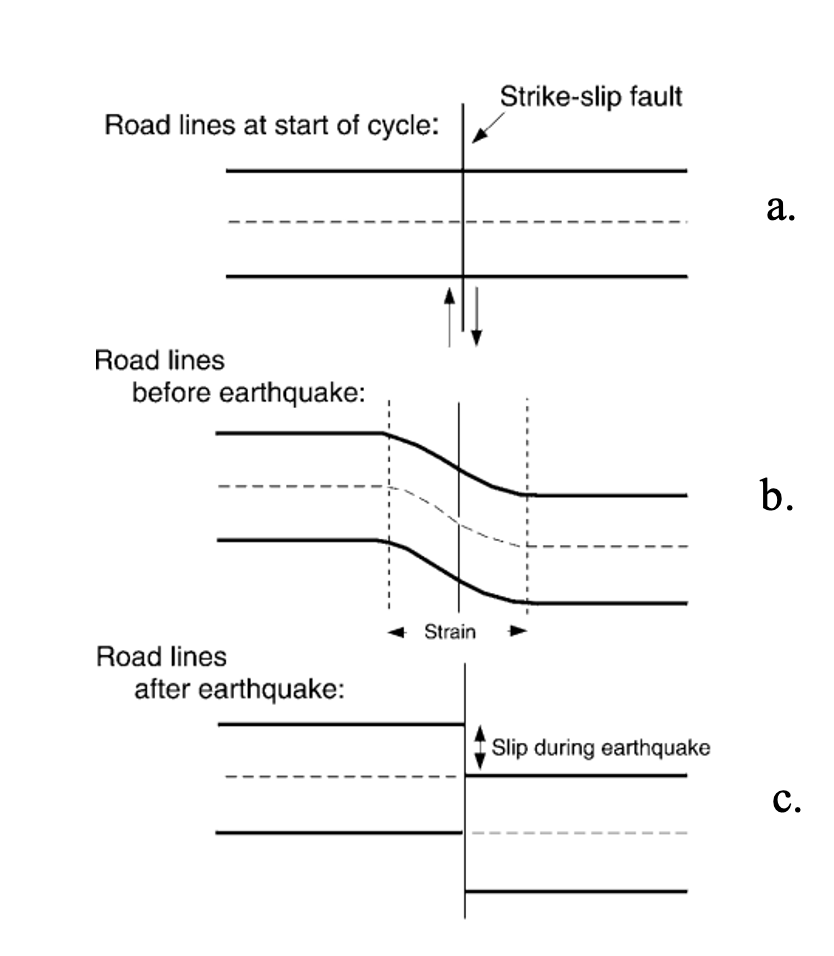
Harry Reid was part of the group commissioned by the governor of California to study the effects of this 1906 earthquake, which almost destroyed San Francisco as well as many other towns along the 200-mile rip in the crust. Significantly, he used his previous experiences with glaciology and the movements of glaciers to begin developing an explanation for this earthquake. Reid looked at three survey events in the area, collected during the decades prior to the 1906 event: I – 1852 to 1865; II – 1874 to 1892; and III – 1906, depicted in Figure 10.Based on these data sets, Reid (1910) made several claims:
- The strain, or deformation of the bedrock, seen by the curved path of the survey markers in survey II, decreased further east and west of the fault line.
- The displacement in the path of survey markers observed in survey III decreases north and south along the fault, away from the epicentre. In other words, the curved path of a new set of survey markers in aline north or south of the epicenter will not show so much curve.
- The displacement occurred suddenly, ruling out a gradual compressional or extensional force to cause this pattern of deformation.
- Because displacement was horizontal, the force could not be gravitational. Gravity would be responsible for vertical displacements.
- The Farallon Islands, far west of the event, showed the six meters of displacement, but none of the strain.
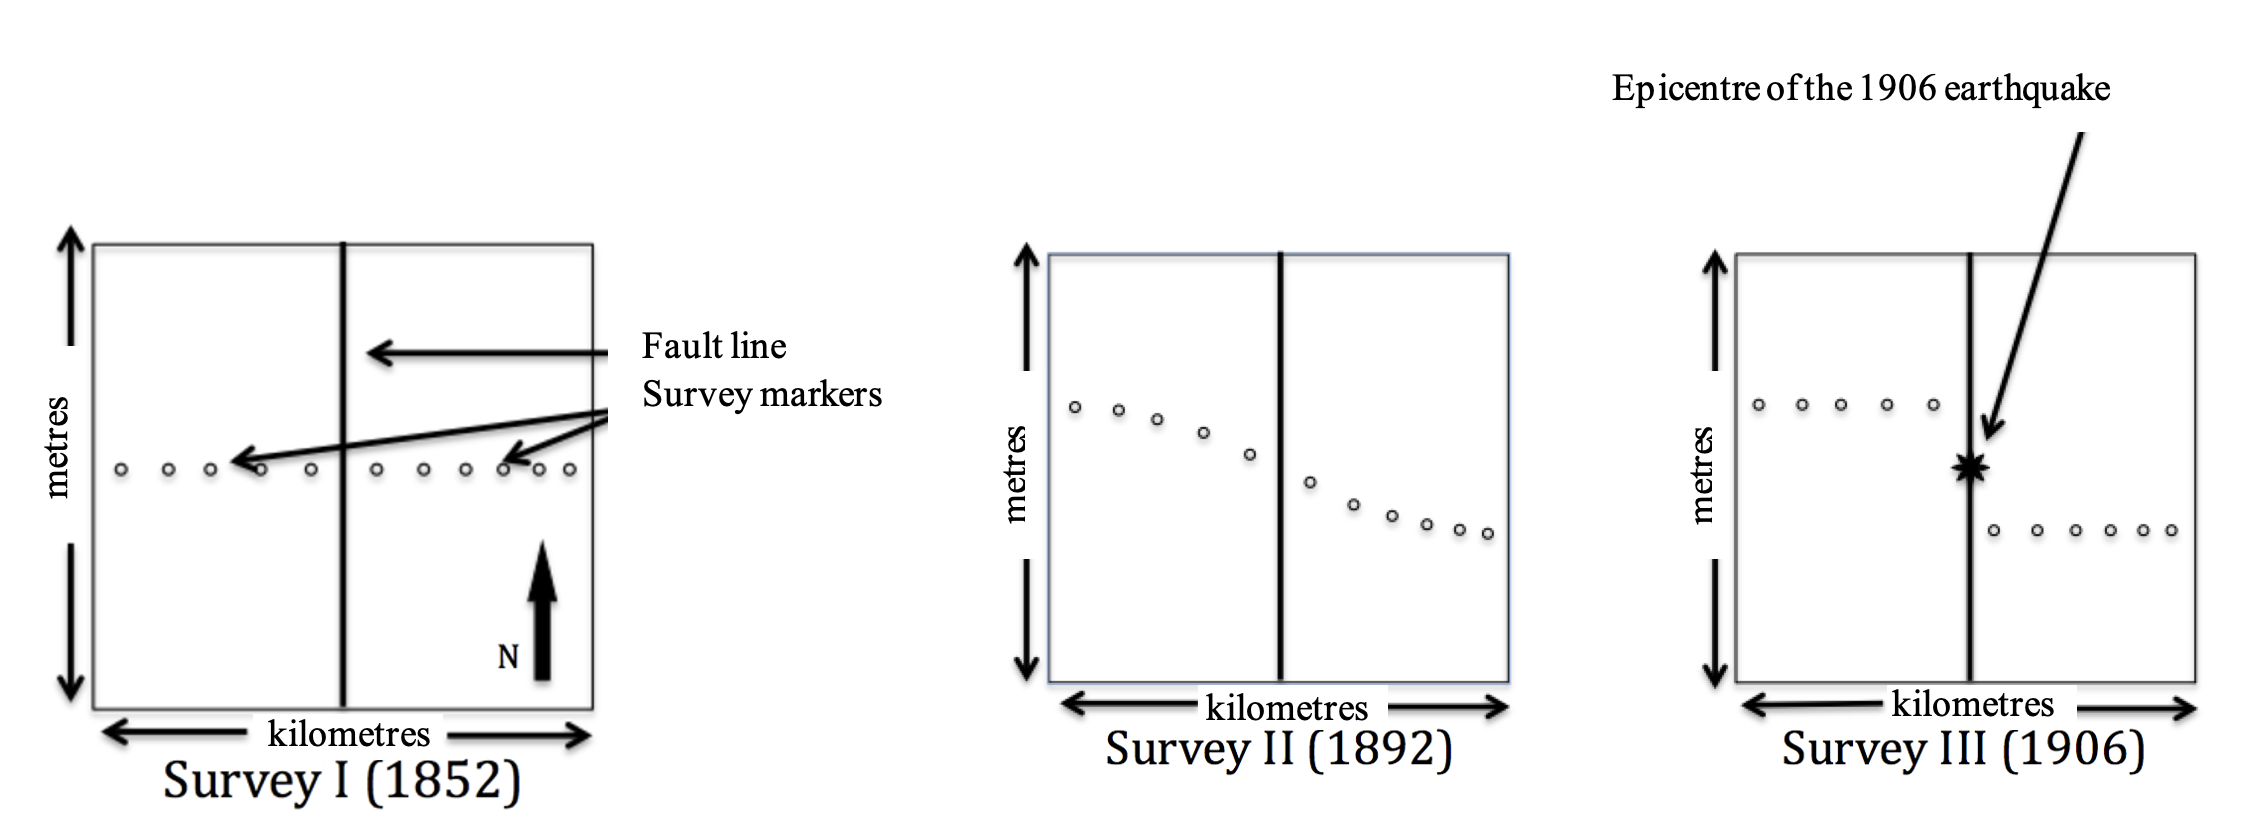
Figure 11 shows how Reid (1910) interpreted the data: (a) He assumed a time when no displacement existed across the fault; (b) A horizontal displacement occurred from through the time of each of the surveys. West of the fault was moving in a northerly direction, and east of the fault was moving in a relatively southern direction. However, during this time there was no actual displacement along the fault. Instead, strain gradually built up, resulting in a deformation, much like the bending of a large stick that will bend back once the stress is removed. (c) Eventually, the strain build-up was too much for the strength of the rock and the rock broke along the fault. When this happened, the energy in the rock, stored as strain, was released as the rocks elastically returned to their normal, unstrained structure.
Based on these observations, Reid asserted that the crust was exposed to strain, causing it to deform and finally fail, which was the earthquake. This strained stored potential elastic energy in the earth, which was released when that rupture took place. Measuring the size of an earthquake could be done by calculating the amount of energy it released. Notions of maximum acceleration of the crust during an earthquake, following Cancani’s work on absolute intensity, are theoretically quite similar to the notion of moment magnitude (Mw). This concept emerged from the work of geophysicists who worked through to the 1960s and 1970s to define how to measure the amount of energy released during an earthquake. Mw is based on the calculation of the seismic moment (Mo). Simply put, the seismic moment is the amount of force needed to move a certain amount of crust a certain distance in an earthquake. The
calculation relies on the rigidity of the crust or how much it resists deformation (µ), the area of the ruptured crust (A), and the distance of displacement of one side of the fault relative to the other side (D):
Mo = µ x D x A
Once calculated, the seismic moment becomes part of the Moment Magnitude equation:
Mw= 2/3 x log Mo – 10.7
In the end, it is not so important to know the equation for Mw, but instead, the variables used within the equation and what they stand for. The rigidity of the rock (µ), the distance of slip (D), and the area of the rupture (A) are all measurable variables that do not rely on feelings of shaking, or the effects of shaking. Rather, they rely on the geology and the construction of the buildings being affected. Mw does not rely on the amplitude of seismic waves to describe the size of an earthquake, like Richter Magnitude does. In this way, seismologists created a way to measure the size of an earthquake—the amount of energy released during failure of the strained crust—using measurable characteristics that were not subject to the geology or a particular type of seismometer. It was a way to make magnitude, or “size” a universal quantity, directly comparable from one event to another.
Epilogue
These concepts of earthquake intensity, which is the damage an earthquake causes, and earthquake magnitude, which is energy released by an earthquake, are often conflated by the general public—even by those communicating about earthquakes for the news media. This is problematic when considering their importance in the current implementation of the Canadian earthquake early warning system (EEW). The EEW is triggered when seismic stations begin registering seismic waves from an earthquake. Based on the earliest signals received, the system will calculate an earthquake magnitude and then project possible intensities for different affected regions in Canada (Earthquakes Canada, 2025).
If a certain threshold of magnitude and intensity are reached for an area, that area will receive an EEW warning message to take appropriate safety actions; drop, cover, and hold on. If the magnitude threshold is met, but not the intensity threshold, then no message is sent. A key concern here is that if messages are sent out, but with no need to take protective action, the Canadian public may begin to take these messages for granted or simply ignore them. Thus, when a message is broadcast based on high intensity, the public may overlook or simply not heed the message. Thus, a consensus and widespread understanding of these two concepts is critical, since they are the crucial components invoked to decide who does and does not receive the EEW warning message. If the public are informed about why some get such a message and other do not, they are more likely to maintain trust in the system. It is trust in the system that can save lives and property.
As this review highlights, intensity is not just dependent on the magnitude of the earthquake, but also on the distance from the epicentre. Dolomieu also showed that earthquake intensity depends on the local geology: where the ground comprises unconsolidated sediments, shaking is amplified and much worse when compared to adjacent areas with ground composed of solid or crystalline rock. We also learned from Mallet that seismic waves travel at different speeds through different earth materials—slower in unconsolidated materials and faster through solid materials. All of this also contributes to the calculations the EEW system makes when deciding when and where to send early warnings.
During the recent 2023 earthquake on the border of Turkey and Syria 2023, more than 50,000 people died. Many factors contribute to this grim statistic. The earthquake happened in the middle of the night when people were sleeping, many in apartment buildings that were not built to withstand the kind of shaking they experienced. Additionally, no national, reliable EEW system is in place. Google does have an EEW, but it works only for Android users but it is unclear whether messages were received by people after the earthquake happened.
Researchers believe that a functional and reliable EEW system could save 30% of lives that would otherwise be lost, all else being equal. For an EEW system to be reliable, it must (a) have the capacity to warn people early enough that they can take protective action, (b) be seen by the public as trustworthy, and (c) and notify a public with knowledge about what to do in the event they receive such a message. Unquestionably, educating the public about earthquakes, intensity, and magnitude is an important goal that will minimize loss of life and property in the event of a serious earthquake.
Acknowledgements
Developing this historical case study would not have been possible without the generous funding from Natural Resources Canada.
References
Bačić, Mario et al. (2020). The usefulness of seismic surveys for geotechnical engineering in karst: Some practical examples. Distributed under CC by 4.0 here https://www.mdpi.com/2076-3263/10/10/406
Bonham, J. (2021). Apparent magnitude versus absolute magnitude. Learn the Sky. https://www.learnthesky.com/blog/apparent-versus-absolute-magnitude
Brewer, K. & Kerley, P. (2023, February 6). Turkey earthquake: The eyewitness who captured the quake on social media. BBC News. https://www.bbc.com/news/world-64541194
Camelbeeck, T., Knuts, E., Alexandre, P. Lecocq, T. T., & Van Noten, K. (2021). The 23 February 1828 Belgian earthquake: A destructive moderate event typical of the seismic activity in Western Europe. Journal of Seismology 25, 369–391 (2021). https://doi.org/10.1007/s10950-020-09977-6
Carter, J. (2023). The world’s deadliest earthquake? Look to Shaanxi, 1556. The China Project, Society and Culture. https://thechinaproject.com/2023/01/25/the-worlds-deadliest-earthquake-look-to-shaanxi-1556/
Crickett. (2006). Seismogram.gif. Wikimedia Commons. https://commons.wikimedia.org/wiki/File:Seismogram.gif#file
Current World Archeology. (2016, September 28). Earthquake! How the earth shook up the past. The Past. https://the-past.com/feature/earthquake-how-the-earth-shook-up-the-past/
Davison, C. (1927). Founders of Seismology. Cambridge University Press.
Earthquakes Canada. (2025). Canadian earthquake early warning. https://www.earthquakescanada.nrcan.gc.ca/eew-asp/system-en.php
Earthquakes Hazards Program (n.d.). Earthquake legends. U.S. Geological Survey. https://www.usgs.gov/programs/earthquake-hazards/earthquake-legends
Given, D. D., Allen, R. M., Baltay, A. S., Bodin, P., Cochran, E. S., Creager, K., de Groot, R. M., Gee, L. S., Hauksson, E., Heaton, T. H., Hellweg, M., Murray, J. R., Thomas, V. I., Toomey, D., & Yelin, T. S. (2018). Revised technical implementation plan for the ShakeAlert system—An earthquake early warning system for the West Coast of the United States [Open-File Report 2018–1155]. U.S. Geological Survey, 42 p. https://doi.org/10.3133/ofr20181155
Gutenberg, B., & Richter, C. F. (1941). Seismicity of the earth. [Geological Society of America Special Papers]. Geological Society of America, 34. https://doi.org/10.1130/SPE34
Hough, S. E. (2007). Richter’s scale. Princeton University Press.
Hough, S. E., & Bilham, R. G. (2006). After the earth quakes: Elastic rebound on an urban planet. Oxford University Press. https://academic.oup.com/book/40874
Mallet, R. (1846). On the dynamics of earthquakes: Being an attempt to reduce their observed phenomena to the known laws of wave motion in solids and fluids. The Transactions of the Royal Irish Academy, 21, 51–105. Royal Irish Academy. https://www.jstor.org/stable/30078999
Mercalli, G. (1883). The Phenomena of Volcanoes in Italy. Tipografia dell'Accademia dei Lincei.
Michel, J. (1751/2009). A treatise of artificial magnets: In which is shown an easy and expeditious method of making them, superior to the best natural ones. Kessinger Publishing.
Milne J. (1886/2024). Earthquakes and other earth movements. International Scientific Series, Volume LV. Gutenberg.org. https://www.gutenberg.org/cache/epub/60007/pg60007-images.html
Love, A. E. H., (1911). Some problems of geodynamics. Cambridge University Press.
Oldham, R. D. (1906). The constitution of the interior of the earth, as revealed by earthquakes. Quarterly Journal of the Geological Society, 62. 456–475. https://doi.org/10.1144/GSL.JGS.1906.062.01-04.21
Oxford English Dictionary. (2010). Earthquake (n.). In OED.com dictionary. Retrieved: 16/09/2923. URL: https://doi.org/10.1093/OED/9651910817
Kowlonese. (2004). https://en.wikipedia.org/wiki/File:EastHanSeismograph.JPG
Lord Rayleigh (1885). On Waves Propagated along the Plane Surface of an Elastic Solid. Proceedings of the London Mathematical Society, s1-17(1), 4-11.
Reid, H. F. (1910). The mechanics of the earthquake (The California earthquake of April 18, 1906: Report of the state earthquake investigation commission in two volumes and atlas, Issue. N. Press.
Reuters. (2023, February 25). Turkey expands probe of building collapses, quake toll tops 50,000. VOA News. https://www.voanews.com/a/turkey-expands-probe-of-building-collapses-quake-toll-tops-50-000/6978866.html#:~:text=That%20took%20the%20number%20of,in%20the%20country's%20modern%20
Richter, C. F. (1935). An instrumental earthquake magnitude scale. Bulletin of the Seismological Society of America, 25(1), 1–32. https://doi.org/10.1785/bssa0250010001
Richter, C. F. (1958) Elementary seismology. W. H. Freeman and Company. https://ia601505.us.archive.org/8/items/in.ernet.dli.2015.135935/2015.135935.Elementary-Seismology_text.pdf
Somerville, P., & Evans, J., (2023). Cause and surface faulting of the Türkiye earthquakes of February 6, 2023. Risk Frontiers, briefing note 478. https://riskfrontiers.com/wp-content/uploads/2023/02/Turkey-Earthquakes-compressed.pdf
Tappan, E. M. (1914). The world’s story: A history of the world in story, song and art. Vol. 5: Italy, France, Spain, and Portugal. Houghton Mifflin Company.https://archive.org/details/worldsstoryhisto05tapp/page/n13/mode/2up
Thanks to Catholicism. (2013). Father Timoteo Bertelli and tromometer. Thanks to Catholocism blog. https://allthingscatholic.tumblr.com/post/37315287796/fr-timoteo-bertelli-bologna-6-october-1826
United States Geological Survey. (1993). Isoseismal map for the 1872 earthquake in Washington state. Wikimedia Commons. https://commons.wikimedia.org/wiki/File:1872_North_Cascades_Isoseismal_Map.png
United States Geological Survey. (2023). M 7.8 - Pazarcik earthquake, Kahramanmaras earthquake sequence. Earthquake Hazards Program. https://earthquake.usgs.gov/earthquakes/eventpage/us6000jllz/executive
Varga, P. (2008). History of early isoseismal maps. Acta Geodaetica et Geophysica Hungarica, 43(2–3), 285–307. https://doi.org/10.1556/ageod.43.2008.2-3.15


